Logitech 2013 Annual Report Download - page 104
Download and view the complete annual report
Please find page 104 of the 2013 Logitech annual report below. You can navigate through the pages in the report by either clicking on the pages listed below, or by using the keyword search tool below to find specific information within the annual report.-
 1
1 -
2
-
3
-
4
-
5
-
6
-
7
-
8
-
9
-
10
-
11
-
12
-
13
-
14
-
15
-
16
-
17
-
18
-
19
-
20
-
21
-
22
-
23
-
24
-
25
-
26
-
27
-
28
-
29
-
30
-
31
-
32
-
33
-
34
-
35
-
36
-
37
-
38
-
39
-
40
-
41
-
42
-
43
-
44
-
45
-
46
-
47
-
48
-
49
-
50
-
51
-
52
-
53
-
54
-
55
-
56
-
57
-
58
-
59
-
60
-
61
-
62
-
63
-
64
-
65
-
66
-
67
-
68
-
69
-
70
-
71
-
72
-
73
-
74
-
75
-
76
-
77
-
78
-
79
-
80
-
81
-
82
-
83
-
84
-
85
-
86
-
87
-
88
-
89
-
90
-
91
-
92
-
93
-
 94
94 -
 95
95 -
 96
96 -
 97
97 -
 98
98 -
 99
99 -
 100
100 -
 101
101 -
 102
102 -
 103
103 -
 104
104 -
 105
105 -
 106
106 -
 107
107 -
 108
108 -
 109
109 -
 110
110 -
 111
111 -
 112
112 -
 113
113 -
 114
114 -
115
-
116
-
117
-
118
-
119
-
120
-
121
-
122
-
123
-
124
-
125
-
126
-
127
-
128
-
129
-
130
-
131
-
132
-
133
-
134
-
135
-
136
-
137
-
138
-
139
-
140
-
141
-
142
-
143
-
144
-
145
-
146
-
147
-
148
-
149
-
150
-
151
-
152
-
153
-
154
-
155
-
156
-
157
-
158
-
159
-
160
-
161
-
162
-
163
-
164
-
165
-
166
-
167
-
168
-
169
-
170
-
171
-
172
-
173
-
174
-
175
-
176
-
177
-
178
-
179
-
180
-
181
-
182
-
183
-
184
-
185
-
186
-
187
-
188
-
189
-
190
-
191
-
192
-
193
-
194
-
195
-
196
-
197
-
198
-
199
-
200
-
201
-
202
-
203
-
204
-
205
-
206
-
207
-
208
-
209
-
210
-
211
-
212
-
213
-
214
-
215
-
216
-
217
-
218
-
219
-
220
-
221
-
222
-
223
-
224
 |
 |

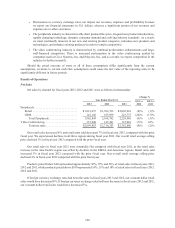
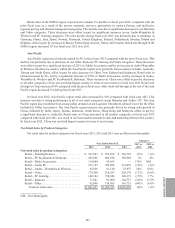
Retail Sales by Region
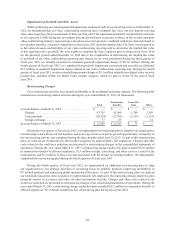
The following table presents the change in retail sales by region and the change in constant dollar retail sales
if foreign currency exchange rates had been the same in fiscal year 2013 compared with fiscal year 2012, and fiscal
year 2012 compared with fiscal year 2011:
2013 vs 2012 2012 vs 2011
Change in
Retail Units
Sold
Change in
Retail Sales
Change in
Constant Dollar
Retail Sales
Change in
Retail Units
Sold
Change in
Retail Sales
Change in
Constant Dollar
Retail Sales
Americas ................. (4)% (7)% (7)% (5)% (7)% (7)%
EMEA ................... (11)% (11)% (7)% (3)% (2)% (4)%
Asia Pacific ............... (5)% (4)% (4)% 25% 18 % 15 %
Total retail sales ......... (7)% (8)% (6)% 3% (1)% (3)%
We use retail sell-through data, which represents sales of our products by our retailer customers to consumers,
and by our distributor customers to their customers, along with other metrics, to assess consumer demand for our
products. Sell-through data is subject to limitations due to collection methods and the third party nature of the
data. Although the sell-through data we obtained typically represents a majority of our retail sales, the customers
supplying sell-through data vary by geographic region and from period-to-period. As a result of these limitations,
sell-through data may not be an accurate indicator of actual consumer demand for our products.
Americas
The Americas region experienced a 7% decline in retail sales during the fiscal year ended March 31, 2013,
compared with the prior fiscal year. This decline was primarily from a significant decrease in our Other category,
comprised of products that are no longer strategic to our business, and from decreases in our Video, Remotes,
PC Gaming and Pointing Device categories. These decreases were offset in part by an increase of 108% in Tablet
Accessories due to continued strong demand from the Logitech Ultrathin Keyboard Cover for the iPad. During
fiscal year 2013, we experienced weakness primarily in the United States, offset in part by improvement in Mexico
and Brazil. Retail sell-through in the Americas region decreased 5% in fiscal year 2013 compared with the prior
fiscal year.
Retail sales in the Americas region experienced a 7% decline during fiscal year 2012 compared with fiscal
year 2011. This decline was primarily due to significant decreases in our Other, Remotes and Video categories.
This decline was offset in part by a significant increase in revenue from our then newly created Tablet Accessories
category due to strong demand from the Logitech Ultrathin Keyboard Cover for the iPad, and from a significant
increase in our Audio-Wearables & Wireless and PC Gaming categories. The sales decline during fiscal year 2012
was due to weakness in the United States and Canada. Retail sell-through in the Americas region increased 2% in
fiscal year 2012 over fiscal year 2011.
EMEA
Retail sales in the EMEA region experienced an 11% decline during the fiscal year ended March 31, 2013,
compared with the prior fiscal year, caused by extreme weakness in the PC market and from continued macro-
economic uncertainty across many European countries. This decline was due to weakness in all product categories
except Tablet Accessories which increased by 322%. During fiscal year 2013, we experienced significant sales
decreases in Germany, France, Switzerland, Poland, Spain, Russia, Netherlands, Norway, Czech Republic, Austria,
Greece, Croatia and Finland, offset in part by significant increases in Turkey, Denmark, Belarus, Italy and Lithuania.
Retail sell-through in the EMEA region decreased 14% in fiscal year 2013, compared with the prior fiscal year.
102