Logitech 2003 Annual Report Download - page 81
Download and view the complete annual report
Please find page 81 of the 2003 Logitech annual report below. You can navigate through the pages in the report by either clicking on the pages listed below, or by using the keyword search tool below to find specific information within the annual report.-
 1
1 -
2
-
3
-
4
-
5
-
6
-
7
-
8
-
9
-
10
-
11
-
12
-
13
-
14
-
15
-
16
-
17
-
18
-
19
-
20
-
21
-
22
-
23
-
24
-
25
-
26
-
27
-
28
-
29
-
30
-
31
-
32
-
33
-
34
-
35
-
36
-
37
-
38
-
39
-
40
-
41
-
42
-
43
-
44
-
45
-
46
-
47
-
48
-
49
-
50
-
51
-
52
-
53
-
54
-
55
-
56
-
57
-
58
-
59
-
60
-
61
-
62
-
63
-
64
-
65
-
66
-
67
-
68
-
69
-
70
-
 71
71 -
 72
72 -
 73
73 -
 74
74 -
 75
75 -
 76
76 -
 77
77 -
 78
78 -
 79
79 -
 80
80 -
 81
81 -
 82
82 -
 83
83 -
 84
84 -
 85
85 -
 86
86 -
 87
87 -
 88
88 -
 89
89 -
 90
90 -
 91
91 -
92
-
93
-
94
-
95
-
96
-
97
-
98
-
99
-
100
-
101
-
102
-
103
-
104
-
105
-
106
-
107
-
108
-
109
-
110
-
111
-
112
-
113
-
114
-
115
-
116
-
117
-
118
-
119
-
120
-
121
-
122
-
123
-
124
-
125
-
126
-
127
-
128
-
129
-
130
-
131
-
132
-
133
-
134
-
135
-
136
-
137
-
138
-
139
-
140
-
141
-
142
-
143
-
144
-
145
-
146
-
147
-
148
-
149
-
150
-
151
-
152
-
153
-
154
-
155
-
156
-
157
-
158
-
159
-
160
-
161
-
162
-
163
-
164
-
165
-
166
-
167
-
168
-
169
-
170
-
171
-
172
-
173
-
174
-
175
-
176
-
177
-
178
-
179
-
180
-
181
-
182
-
183
-
184
-
185
-
186
-
187
-
188
-
189
-
190
-
191
-
192
-
193
-
194
 |
 |

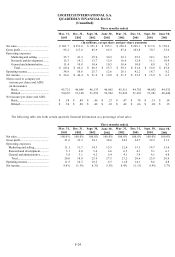
F-24
LOGITECH INTERNATIONAL S.A.
QUARTERLY FINANCIAL DATA
(Unaudited)
Mar. 31,
2003
Dec. 31,
2002
Sept. 30,
2002
June 30,
2002
Mar. 31,
2002
Dec. 31,
2001
Sept. 30,
2001
June 30,
2001
Net sales............................................ 301.7$ 351.8$ 251.8$ 195.1$ 256.0$ 299.1$ 217.6$ 170.9$
Gross profit....................................... 95.2 117.0 85.9 66.3 87.4 103.8 70.7 53.6
Operating expenses:
Marketing and selling ................ 33.7 41.3 35.9 30.3 32.1 39.2 32.1 26.7
Research and development......... 15.3 14.2 13.7 12.9 16.6 12.4 11.1 10.4
General and administrative......... 11.4 10.8 10.6 10.5 10.6 10.0 8.8 8.3
Total........................................ 60.4$ 66.2$ 60.3$ 53.7$ 59.3$ 61.6$ 52.0$ 45.4$
Operating income.............................. 34.8 50.8 25.7 12.6 28.1 42.2 18.7 8.2
Net income........................................ 26.6$ 40.4$ 21.0$ 10.8$ 21.5$ 33.2$ 13.9$ 6.3$
Shares used to compute net
income per share and ADS:
(in thousands):
Basic........................................... 45,721 46,046 46,133 46,065 45,511 44,782 44,892 44,532
Diluted........................................ 50,607 51,168 51,593 52,542 52,422 51,291 51,281 48,446
Net income per share and ADS:
Basic........................................... .58 $ .88 $ .46 $ .23 $ .47 $ .74 $ .31 $ .14 $
Diluted........................................ .54 $ .80 $ .42 $ .22 $ .42 $ .66 $ .28 $ .13 $
Mar. 31,
2003
Dec. 31,
2002
Sept. 30,
2002
June 30,
2002
Mar. 31,
2002
Dec. 31,
2001
Sept. 30,
2001
June 30,
2001
Net sales............................................ 100.0% 100.0% 100.0% 100.0% 100.0% 100.0% 100.0% 100.0%
Gross profit....................................... 31.6 33.3 34.1 34.0 34.2 34.7 32.5 31.3
Operating expenses:
Marketing and selling.................... 11.1 11.7 14.3 15.5 12.6 13.1 14.7 15.6
Research and development............ 5.1 4.0 5.4 6.6 6.5 4.1 5.1 6.1
General and administrative............ 3.8 3.1 4.2 5.4 4.1 3.4 4.1 4.8
Total........................................... 20.0 18.8 23.9 27.5 23.2 20.6 23.9 26.6
Operating income.............................. 11.5 14.5 10.2 6.5 11.0 14.1 8.6 4.8
Net income........................................ 8.8% 11.5% 8.3% 5.5% 8.4% 11.1% 6.4% 3.7%
Three months ended,
(In millions, except share and per share amounts)
Three months ended,
The following table sets forth certain quarterly financial information as a percentage of net sales: