Logitech 2003 Annual Report Download - page 46
Download and view the complete annual report
Please find page 46 of the 2003 Logitech annual report below. You can navigate through the pages in the report by either clicking on the pages listed below, or by using the keyword search tool below to find specific information within the annual report.-
 1
1 -
2
-
3
-
4
-
5
-
6
-
7
-
8
-
9
-
10
-
11
-
12
-
13
-
14
-
15
-
16
-
17
-
18
-
19
-
20
-
21
-
22
-
23
-
24
-
25
-
26
-
27
-
28
-
29
-
30
-
31
-
32
-
33
-
34
-
35
-
 36
36 -
 37
37 -
 38
38 -
 39
39 -
 40
40 -
 41
41 -
 42
42 -
 43
43 -
 44
44 -
 45
45 -
 46
46 -
 47
47 -
 48
48 -
 49
49 -
 50
50 -
 51
51 -
 52
52 -
 53
53 -
 54
54 -
 55
55 -
 56
56 -
57
-
58
-
59
-
60
-
61
-
62
-
63
-
64
-
65
-
66
-
67
-
68
-
69
-
70
-
71
-
72
-
73
-
74
-
75
-
76
-
77
-
78
-
79
-
80
-
81
-
82
-
83
-
84
-
85
-
86
-
87
-
88
-
89
-
90
-
91
-
92
-
93
-
94
-
95
-
96
-
97
-
98
-
99
-
100
-
101
-
102
-
103
-
104
-
105
-
106
-
107
-
108
-
109
-
110
-
111
-
112
-
113
-
114
-
115
-
116
-
117
-
118
-
119
-
120
-
121
-
122
-
123
-
124
-
125
-
126
-
127
-
128
-
129
-
130
-
131
-
132
-
133
-
134
-
135
-
136
-
137
-
138
-
139
-
140
-
141
-
142
-
143
-
144
-
145
-
146
-
147
-
148
-
149
-
150
-
151
-
152
-
153
-
154
-
155
-
156
-
157
-
158
-
159
-
160
-
161
-
162
-
163
-
164
-
165
-
166
-
167
-
168
-
169
-
170
-
171
-
172
-
173
-
174
-
175
-
176
-
177
-
178
-
179
-
180
-
181
-
182
-
183
-
184
-
185
-
186
-
187
-
188
-
189
-
190
-
191
-
192
-
193
-
194
 |
 |

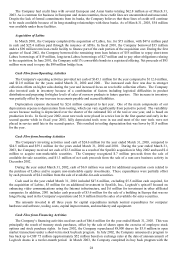
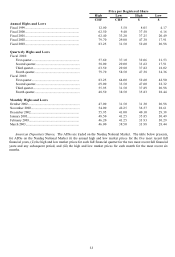
33
High Low High Low
CHF CHF $ $
Annual Highs and Lows
Fiscal 1999................................................................... 12.00 5.58 8.05 4.17
Fiscal 2000................................................................... 62.50 9.40 37.58 6.16
Fiscal 2001................................................................... 62.40 33.20 37.25 20.49
Fiscal 2002................................................................... 79.70 29.00 47.38 17.91
Fiscal 2003................................................................... 83.25 31.50 52.60 20.98
Quarterly Highs and Lows
Fiscal 2002:
First quarter........................................................... 57.60 37.10 32.06 21.53
Second quarter....................................................... 58.00 29.00 33.62 17.91
Third quarter.......................................................... 63.50 29.80 37.82 18.02
Fourth quarter........................................................ 79.70 58.50 47.38 34.36
Fiscal 2003:
First quarter........................................................... 83.25 64.00 52.60 42.90
Second quarter....................................................... 69.00 33.50 47.00 22.32
Third quarter.......................................................... 55.95 31.50 37.89 20.98
Fourth quarter........................................................ 48.50 38.50 35.83 28.44
Monthly Highs and Lows
October 2002................................................................ 47.00 31.50 31.30 20.98
November 2002............................................................ 54.00 42.25 36.57 28.61
December 2002............................................................ 55.95 41.00 40.10 29.38
January 2003................................................................ 48.50 41.25 35.85 30.49
February 2003.............................................................. 46.20 41.25 33.93 30.29
March 2003.................................................................. 46.00 38.50 33.98 28.44
Price per Registered Share
American Depositary Shares. The ADSs are traded on the Nasdaq National Market. The table below presents,
for ADSs on the Nasdaq National Market (i) the annual high and low market prices for the five most recent full
financial years, (ii) the high and low market prices for each full financial quarter for the two most recent full financial
years and any subsequent period, and (iii) the high and low market prices for each month for the most recent six
months.