Logitech 2003 Annual Report Download - page 19
Download and view the complete annual report
Please find page 19 of the 2003 Logitech annual report below. You can navigate through the pages in the report by either clicking on the pages listed below, or by using the keyword search tool below to find specific information within the annual report.-
 1
1 -
2
-
3
-
4
-
5
-
6
-
7
-
8
-
 9
9 -
 10
10 -
 11
11 -
 12
12 -
 13
13 -
 14
14 -
 15
15 -
 16
16 -
 17
17 -
 18
18 -
 19
19 -
 20
20 -
 21
21 -
 22
22 -
 23
23 -
 24
24 -
 25
25 -
 26
26 -
 27
27 -
 28
28 -
 29
29 -
30
-
31
-
32
-
33
-
34
-
35
-
36
-
37
-
38
-
39
-
40
-
41
-
42
-
43
-
44
-
45
-
46
-
47
-
48
-
49
-
50
-
51
-
52
-
53
-
54
-
55
-
56
-
57
-
58
-
59
-
60
-
61
-
62
-
63
-
64
-
65
-
66
-
67
-
68
-
69
-
70
-
71
-
72
-
73
-
74
-
75
-
76
-
77
-
78
-
79
-
80
-
81
-
82
-
83
-
84
-
85
-
86
-
87
-
88
-
89
-
90
-
91
-
92
-
93
-
94
-
95
-
96
-
97
-
98
-
99
-
100
-
101
-
102
-
103
-
104
-
105
-
106
-
107
-
108
-
109
-
110
-
111
-
112
-
113
-
114
-
115
-
116
-
117
-
118
-
119
-
120
-
121
-
122
-
123
-
124
-
125
-
126
-
127
-
128
-
129
-
130
-
131
-
132
-
133
-
134
-
135
-
136
-
137
-
138
-
139
-
140
-
141
-
142
-
143
-
144
-
145
-
146
-
147
-
148
-
149
-
150
-
151
-
152
-
153
-
154
-
155
-
156
-
157
-
158
-
159
-
160
-
161
-
162
-
163
-
164
-
165
-
166
-
167
-
168
-
169
-
170
-
171
-
172
-
173
-
174
-
175
-
176
-
177
-
178
-
179
-
180
-
181
-
182
-
183
-
184
-
185
-
186
-
187
-
188
-
189
-
190
-
191
-
192
-
193
-
194
 |
 |

6
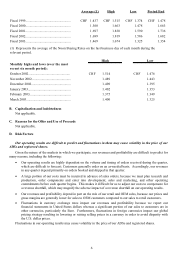
Fiscal 1999...................................................... CHF 1.437 CHF 1.515 CHF 1.374 CHF 1.478
Fiscal 2000...................................................... 1.560 1.663 1.478 1.663
Fiscal 2001...................................................... 1.697 1.830 1.590 1.736
Fiscal 2002...................................................... 1.699 1.819 1.586 1.682
Fiscal 2003...................................................... 1.469 1.674 1.325 1.354
(1) Represents the average of the Noon Buying Rates on the last business day of each month during the
relevant period.
Monthly highs and lows (over the most
recent six month period):
October 2002.................................................. CHF 1.514 CHF 1.476
November 2002............................................... 1.489 1.443
December 2002............................................... 1.490 1.395
January 2003................................................... 1.402 1.353
February 2003................................................. 1.375 1.349
March 2003..................................................... 1.400 1.325
Low
High Low Period End
High
Average (1)
B. Capitalization and Indebtedness
Not applicable.
C. Reasons for the Offer and Use of Proceeds
Not applicable.
D. Risk Factors
Our operating results are difficult to predict and fluctuations in them may cause volatility in the price of our
ADSs and registered shares.
Given the nature of the markets in which we participate, our revenues and profitability are difficult to predict for
many reasons, including the following:
• Our operating results are highly dependent on the volume and timing of orders received during the quarter,
which are difficult to forecast. Customers generally order on an as-needed basis. Accordingly, our revenues
in any quarter depend primarily on orders booked and shipped in that quarter.
• A large portion of our costs must be incurred in advance of sales orders, because we must plan research and
production, order components and enter into development, sales and marketing, and other operating
commitments before each quarter begins. This makes it difficult for us to adjust our costs to compensate for
a revenue shortfall, which may magnify the adverse impact of a revenue shortfall on our operating results.
• Our revenues and profitability depend in part on the mix of our retail and OEM sales, because our prices and
gross margins are generally lower for sales to OEM customers compared to our sales to retail customers.
• Fluctuations in currency exchange rates impact our revenues and profitability because we report our
financial statements in United States dollars whereas a significant portion of our sales to customers are in
other currencies, particularly the Euro. Furthermore, fluctuations in foreign currencies impact our global
pricing strategy resulting in lowering or raising selling prices in a currency in order to avoid disparity with
the U.S. dollar prices.
Fluctuations in our operating results may cause volatility in the price of our ADSs and registered shares.