Logitech 2003 Annual Report Download - page 127
Download and view the complete annual report
Please find page 127 of the 2003 Logitech annual report below. You can navigate through the pages in the report by either clicking on the pages listed below, or by using the keyword search tool below to find specific information within the annual report.-
 1
1 -
2
-
3
-
4
-
5
-
6
-
7
-
8
-
9
-
10
-
11
-
12
-
13
-
14
-
15
-
16
-
17
-
18
-
19
-
20
-
21
-
22
-
23
-
24
-
25
-
26
-
27
-
28
-
29
-
30
-
31
-
32
-
33
-
34
-
35
-
36
-
37
-
38
-
39
-
40
-
41
-
42
-
43
-
44
-
45
-
46
-
47
-
48
-
49
-
50
-
51
-
52
-
53
-
54
-
55
-
56
-
57
-
58
-
59
-
60
-
61
-
62
-
63
-
64
-
65
-
66
-
67
-
68
-
69
-
70
-
71
-
72
-
73
-
74
-
75
-
76
-
77
-
78
-
79
-
80
-
81
-
82
-
83
-
84
-
85
-
86
-
87
-
88
-
89
-
90
-
91
-
92
-
93
-
94
-
95
-
96
-
97
-
98
-
99
-
100
-
101
-
102
-
103
-
104
-
105
-
106
-
107
-
108
-
109
-
110
-
111
-
112
-
113
-
114
-
115
-
116
-
 117
117 -
 118
118 -
 119
119 -
 120
120 -
 121
121 -
 122
122 -
 123
123 -
 124
124 -
 125
125 -
 126
126 -
 127
127 -
 128
128 -
 129
129 -
 130
130 -
 131
131 -
 132
132 -
 133
133 -
 134
134 -
 135
135 -
 136
136 -
 137
137 -
138
-
139
-
140
-
141
-
142
-
143
-
144
-
145
-
146
-
147
-
148
-
149
-
150
-
151
-
152
-
153
-
154
-
155
-
156
-
157
-
158
-
159
-
160
-
161
-
162
-
163
-
164
-
165
-
166
-
167
-
168
-
169
-
170
-
171
-
172
-
173
-
174
-
175
-
176
-
177
-
178
-
179
-
180
-
181
-
182
-
183
-
184
-
185
-
186
-
187
-
188
-
189
-
190
-
191
-
192
-
193
-
194
 |
 |

22
ITEM 5. OPERATING AND FINANCIAL REVIEW AND PROSPECTS
This annual report to shareholders contains forward-looking statements that involve risks and uncertainties.
The Company’s actual results could differ materially from those anticipated in these statements as a result of
certain factors, including those set forth above in Item 3, “Risk Factors”, and below in Item 11, “Quantitative and
Qualitative Disclosure About Market Risk”.
Overview
Logitech International S.A. designs, manufactures and markets personal interface products and supporting
software that serve as the primary physical interface between people and their personal computers and other digital
platforms. The Company’s products include corded and cordless mice, trackballs, and keyboards; joysticks,
gamepads, and racing systems; internet video cameras; speakers, headsets and microphones; and 3D controllers.
The Company sells its products through two primary channels, original equipment manufacturers (“OEMs”) and
a network of retail distributors and resellers (“retail”). Products sold to OEMs, principally pointing devices, are
generally resold to end users bundled with new PCs. Sales to OEMs as a percentage of total net sales can vary
significantly and have ranged from 13% to 33% on a quarterly basis over the past three fiscal years.
Logitech was founded in Switzerland in 1981, and in 1988 listed its shares in an initial public offering in
Switzerland. In 1997, the Company sold shares in a U.S. initial public offering in the form of American Depositary
Shares (“ADS”), and listed the ADSs on the Nasdaq National Market System. The Company’s corporate headquarters
are in Fremont, California through its U.S. subsidiary, with regional headquarters in Romanel, Switzerland, Hsinchu,
Taiwan and Hong Kong, China through local subsidiaries. In addition, Logitech has its principal manufacturing
operations in China, with distribution facilities in the United States, Europe and Asia.
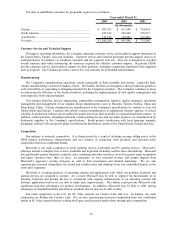
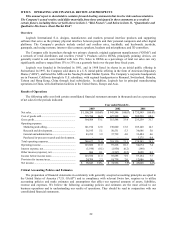
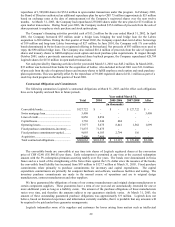
Results of Operations
The following table sets forth certain consolidated financial statement amounts in thousands and as a percentage
of net sales for the periods indicated:
Net sales................................................................... 1,100,288$ 100.0% 943,546$ 100.0
%
735,549$ 100.0%
Cost of goods sold.................................................... 735,784 66.9 627,998 66.6 502,290 68.3
Gross profit.............................................................. 364,504 33.1 315,548 33.4 233,259 31.7
Operating expenses:
Marketing and selling........................................... 141,194 12.8 130,060 13.8 105,140 14.3
Research and development................................... 56,195 5.1 50,531 5.3 36,686 5.0
General and administrative................................... 43,233 3.9 37,739 4.0 33,484 4.6
Purchased in-process research and development.. - - - - 3,275 0.4
Total operating expenses.......................................... 240,622 21.8 218,330 23.1 178,585 24.3
Operating income..................................................... 123,882 11.3 97,218 10.3 54,674 7.4
Interest expense, net................................................. (1,196) (0.1) (1,956) (0.2) (148) -
Other income (expense), net..................................... 866 0.1 (1,567) (0.2) 2,628 0.3
Income before income taxes..................................... 123,552 11.3 93,695 9.9 57,154 7.7
Provision for income taxes....................................... 24,709 2.3 18,739 2.0 12,086 1.6
Net income............................................................... 98,843$ 9.0% 74,956$ 7.9% 45,068$ 6.1%
Year ended March 31,
2003 2002 2001
Critical Accounting Policies and Estimates
The preparation of financial statements in conformity with generally accepted accounting principles accepted in
the United States of America (“U.S. GAAP”) and in compliance with relevant Swiss law, requires us to utilize
accounting policies and make estimates and assumptions that affect our reported amounts of assets, liabilities,
revenue and expenses. We believe the following accounting policies and estimates are the most critical to our
business operations and to understanding our results of operations. They should be read in conjunction with our
consolidated financial statements.