Logitech 2003 Annual Report Download - page 38
Download and view the complete annual report
Please find page 38 of the 2003 Logitech annual report below. You can navigate through the pages in the report by either clicking on the pages listed below, or by using the keyword search tool below to find specific information within the annual report.-
 1
1 -
2
-
3
-
4
-
5
-
6
-
7
-
8
-
9
-
10
-
11
-
12
-
13
-
14
-
15
-
16
-
17
-
18
-
19
-
20
-
21
-
22
-
23
-
24
-
25
-
26
-
27
-
 28
28 -
 29
29 -
 30
30 -
 31
31 -
 32
32 -
 33
33 -
 34
34 -
 35
35 -
 36
36 -
 37
37 -
 38
38 -
 39
39 -
 40
40 -
 41
41 -
 42
42 -
 43
43 -
 44
44 -
 45
45 -
 46
46 -
 47
47 -
 48
48 -
49
-
50
-
51
-
52
-
53
-
54
-
55
-
56
-
57
-
58
-
59
-
60
-
61
-
62
-
63
-
64
-
65
-
66
-
67
-
68
-
69
-
70
-
71
-
72
-
73
-
74
-
75
-
76
-
77
-
78
-
79
-
80
-
81
-
82
-
83
-
84
-
85
-
86
-
87
-
88
-
89
-
90
-
91
-
92
-
93
-
94
-
95
-
96
-
97
-
98
-
99
-
100
-
101
-
102
-
103
-
104
-
105
-
106
-
107
-
108
-
109
-
110
-
111
-
112
-
113
-
114
-
115
-
116
-
117
-
118
-
119
-
120
-
121
-
122
-
123
-
124
-
125
-
126
-
127
-
128
-
129
-
130
-
131
-
132
-
133
-
134
-
135
-
136
-
137
-
138
-
139
-
140
-
141
-
142
-
143
-
144
-
145
-
146
-
147
-
148
-
149
-
150
-
151
-
152
-
153
-
154
-
155
-
156
-
157
-
158
-
159
-
160
-
161
-
162
-
163
-
164
-
165
-
166
-
167
-
168
-
169
-
170
-
171
-
172
-
173
-
174
-
175
-
176
-
177
-
178
-
179
-
180
-
181
-
182
-
183
-
184
-
185
-
186
-
187
-
188
-
189
-
190
-
191
-
192
-
193
-
194
 |
 |
25
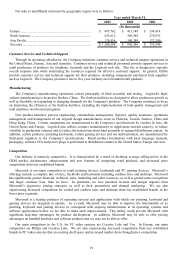
last year. This was primarily due to continued demand for our PC web cameras with contributions from the sales of
the Logitech Pocket Digital camera introduced in May 2002. Our sales of interactive entertainment products for
gaming consoles decreased by 14% and the unit volumes increased by 13%. The decline in sales was due to the
decrease in demand for the GT Force Steering Wheel for PlayStation®2 introduced in late fiscal 2001 and early 2002
partially offset by sales of our new products, the cordless controller for the PlayStation®2, introduced in September
2002, and the Xbox introduced in December 2002. The increase in volume was related to the cordless controllers,
which have a lower average selling price compared to the GT Force Steering Wheel console products sold in 2002.
Despite the popularity of gaming console devices, the market demand for PC gaming products has continued to
decline, and as a result our sales of PC gaming peripherals have declined by 10% as compared to last year while our
volume grew by 5%. The increase in volumes was due to strong demand in the fourth quarter for PC steering wheels.
Sales of our audio products grew by 13% with unit volumes decreasing by 28%. The sales increase was due to the
continued success of the Logitech branded Z series PC speaker family, which was partially offset by lower demand
for the Company’s value-priced Labtec branded product lines. The lower demand for the Labtec branded products
drove the unit volume decreases.
OEM sales increased by 23% compared to last year, principally due to the significant sales in audio products and
cordless desktops. The Company’s OEM audio sales were driven by sales of our USB headsets for the PlayStation2.
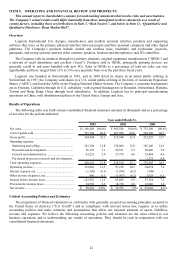
Gross Profit
Gross profit consists of net sales, less cost of goods sold which includes materials, direct labor and related
overhead costs, costs of manufacturing facilities, costs of purchasing finished products from outside suppliers,
distribution costs and inventory reserve provisions. Gross profit increased 16% to $365 million. This increase came
from higher sales volumes partially offset by the slight decrease in gross margin.
Gross margin (gross profit as a percentage of net sales) decreased from 33.4% to 33.1%. The decrease was
primarily due to higher warehousing and freight costs related to higher inventory levels during the second half of the
fiscal year. This inventory growth was driven by a combination of the North American west coast dock strike,
logistical inefficiencies and the decision to carry more inventory to meet expected customer demand. The decrease in
gross margin was also partially due to our channel mix. Our sales mix in fiscal 2003 included a higher percentage of
OEM sales, which have a lower margin than retail sales.
Operating Expenses
Marketing and Selling
Marketing and selling expenses consist of personnel and related overhead costs, corporate and product
marketing, promotions, advertising, trade shows, customer and technical support and facilities costs. Marketing and
selling expense increased 8.6% to $141.2 million. This increase was directly related to the Company’s increased sales
performance resulting in higher commission expenses, marketing initiatives related to the introduction of new
products, particularly the io Pen, and marketing programs related to cordless products. In addition, the increase also
related to the strengthening of the Euro and Swiss Franc relative to the U.S. dollar. As a percentage of sales,
marketing and selling costs decreased from 13.8% to 12.8%.
Research and Development
Research and development expenses consist of personnel and related overhead costs, contractors and outside
consultants, supplies and materials, equipment depreciation and facilities costs, all associated with the design and
development of new products and the enhancements of existing products. Research and development expenses
increased 11.2% to $56.2 million. The increase was mainly due to the higher personnel expenses relating to the
development of new products. In addition, the increase also related to the strengthening of the Euro and Swiss Franc
relative to the U.S. dollar. As a percentage of sales, research and development decreased from 5.3% to 5.1%.
General and Administrative
General and administrative expenses consist primarily of personnel and related overhead and facilities costs for
the finance, information systems, executive, human resources, and legal functions. General and administrative
expense for the year ended March 31, 2003 increased 14.6% to $43.2 million. This increase was primarily due to
increased information technology costs in support of the engineering, operations and human resource functions. In
addition, the increase also related to increased personnel to support the growth of our business and the strengthening
of the Euro and Swiss Franc relative to the U.S. dollar. As a percentage of sales, general and administrative
decreased from 4.0% to 3.9%.