Logitech 2003 Annual Report Download - page 132
Download and view the complete annual report
Please find page 132 of the 2003 Logitech annual report below. You can navigate through the pages in the report by either clicking on the pages listed below, or by using the keyword search tool below to find specific information within the annual report.-
 1
1 -
2
-
3
-
4
-
5
-
6
-
7
-
8
-
9
-
10
-
11
-
12
-
13
-
14
-
15
-
16
-
17
-
18
-
19
-
20
-
21
-
22
-
23
-
24
-
25
-
26
-
27
-
28
-
29
-
30
-
31
-
32
-
33
-
34
-
35
-
36
-
37
-
38
-
39
-
40
-
41
-
42
-
43
-
44
-
45
-
46
-
47
-
48
-
49
-
50
-
51
-
52
-
53
-
54
-
55
-
56
-
57
-
58
-
59
-
60
-
61
-
62
-
63
-
64
-
65
-
66
-
67
-
68
-
69
-
70
-
71
-
72
-
73
-
74
-
75
-
76
-
77
-
78
-
79
-
80
-
81
-
82
-
83
-
84
-
85
-
86
-
87
-
88
-
89
-
90
-
91
-
92
-
93
-
94
-
95
-
96
-
97
-
98
-
99
-
100
-
101
-
102
-
103
-
104
-
105
-
106
-
107
-
108
-
109
-
110
-
111
-
112
-
113
-
114
-
115
-
116
-
117
-
118
-
119
-
120
-
121
-
 122
122 -
 123
123 -
 124
124 -
 125
125 -
 126
126 -
 127
127 -
 128
128 -
 129
129 -
 130
130 -
 131
131 -
 132
132 -
 133
133 -
 134
134 -
 135
135 -
 136
136 -
 137
137 -
 138
138 -
 139
139 -
 140
140 -
 141
141 -
 142
142 -
143
-
144
-
145
-
146
-
147
-
148
-
149
-
150
-
151
-
152
-
153
-
154
-
155
-
156
-
157
-
158
-
159
-
160
-
161
-
162
-
163
-
164
-
165
-
166
-
167
-
168
-
169
-
170
-
171
-
172
-
173
-
174
-
175
-
176
-
177
-
178
-
179
-
180
-
181
-
182
-
183
-
184
-
185
-
186
-
187
-
188
-
189
-
190
-
191
-
192
-
193
-
194
 |
 |
27
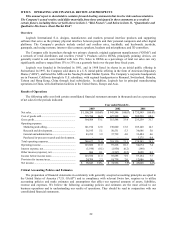
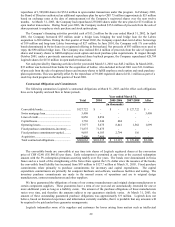
manufacturing cost reductions. OEM product margins also increased due to both continued cost reductions and a sales
mix of higher margin products.
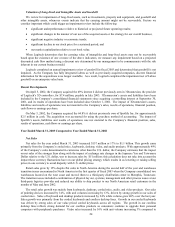
Operating Expenses
Marketing and Selling
Marketing and selling expense increased 24% to $130 million. This increase was directly related to the
Company’s increased sales performance and marketing initiatives aimed at strengthening the Company’s retail
presence. The Company increased marketing costs in new product areas, particularly internet video cameras and
audio products. With the acquisition of Labtec at the end of fiscal year 2001, the Company incurred product
marketing, product and packaging design and advertising costs relating to the audio products. As a percentage of
sales, marketing and selling costs slightly decreased from 14.3% to 13.8%.
Research and Development
Research and development expenses increased 38% to $51 million. The increase was related to new product
development, cost reduction efforts on existing products and increased costs associated with intellectual property used
in our products. As a percentage of sales, research and development increased from 5.0% to 5.3%.
General and Administrative
General and administrative expense for the year ended March 31, 2002 increased 13% to $38 million. This
increase was primarily due to increased headcount and personnel-related expenses. As a percentage of sales, general
and administrative decreased from 4.6% to 4.0%.
Interest Expense, Net
Interest expense for the year ended March 31, 2002 was $2.0 million, compared to $.1 million in 2001. Interest
expense increased due to the short-term borrowing and subsequent issuance of the five-year convertible bonds to
finance the Labtec acquisition and repay Labtec obligations and credit lines. This debt was repaid in June 2001 using
proceeds from the issuance of our convertible bonds.
Other Income (Expense), Net
Other expense was $1.6 million for the year ended March 31, 2002, compared to other income of $2.6 million in
2001. Other expense in fiscal year 2002 included the $1.2 million write-off of an investment and $2.5 million of
losses recorded for investments accounted for under the equity method, partially offset by the $1.1 million gain on the
sale of shares in Immersion Corporation and $.6 million of proceeds from a property loss insurance claim. Other
income in fiscal year 2001 was primarily due to the gains of $1.9 million from the sale of a building and $1.3 million
from the sale of an investment, partially offset by $.7 million of losses recorded as an investment accounted for under
the equity method.
Provision for Income Taxes
The provision for income taxes for the year ended March 31, 2002 was $19 million, representing a 20% effective
tax rate, compared to $12 million, representing a 21% effective tax rate in 2001. In 2001, the effective tax rate was
impacted by certain non-deductible one time purchased in-process research and development expenses of $3.3 million
related to the Labtec acquisition.
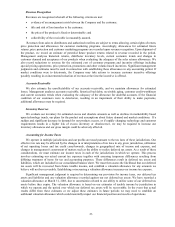
Liquidity and Capital Resources
Cash Balances, Available Borrowings, and Capital Resources
At March 31, 2003, net working capital was $325.7 million, compared to $265.7 million at March 31, 2002. Cash
and cash equivalents totaled $218.7 million, an increase of $75.6 million from March 31, 2002. The increase in cash
during fiscal 2003 was primarily due to profitable operations.
The Company has financed its operations and capital requirements primarily through cash flow from operations
and, to a lesser extent, capital markets and bank borrowings. The Company's normal short-term liquidity and long-
term capital resource requirements will be provided from three sources: ongoing cash flow from operations, cash and
cash equivalents on hand and borrowings, as needed, under the credit facilities.