Kroger 2007 Annual Report Download - page 44
Download and view the complete annual report
Please find page 44 of the 2007 Kroger annual report below. You can navigate through the pages in the report by either clicking on the pages listed below, or by using the keyword search tool below to find specific information within the annual report.-
 1
1 -
2
-
3
-
4
-
5
-
6
-
7
-
8
-
9
-
10
-
11
-
12
-
13
-
14
-
15
-
16
-
17
-
18
-
19
-
20
-
21
-
22
-
23
-
24
-
25
-
26
-
27
-
28
-
29
-
30
-
31
-
32
-
33
-
 34
34 -
 35
35 -
 36
36 -
 37
37 -
 38
38 -
 39
39 -
 40
40 -
 41
41 -
 42
42 -
 43
43 -
 44
44 -
 45
45 -
 46
46 -
 47
47 -
 48
48 -
 49
49 -
 50
50 -
 51
51 -
 52
52 -
 53
53 -
 54
54 -
55
 |
 |

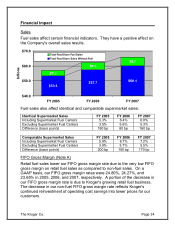
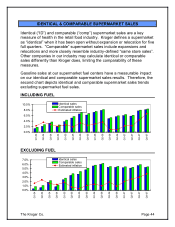
IDENTICAL & COMPARABLE SUPERMARKET SALES
Identical (“ID”) and comparable (“comp”) supermarket sales are a key
measure of health in the retail food industry. Kroger defines a supermarket
as “identical” when it has been open without expansion or relocation for five
full quarters. “Comparable” supermarket sales include expansions and
relocations and more closely resemble industry-defined “same store sales”.
Other companies in our industry may calculate identical or comparable
sales differently than Kroger does, limiting the comparability of these
measures.
Gasoline sales at our supermarket fuel centers have a measurable impact
on our identical and comparable supermarket sales results. Therefore, the
second chart depicts identical and comparable supermarket sales trends
excluding supermarket fuel sales.
INCLUDING FUEL
0.0%
2.0%
4.0%
6.0%
8.0%
10.0%
Q1-04
Q2-04
Q3-04
Q4-04
Q1-05
Q2-05
Q3-05
Q4-05
Q1-06
Q2-06
Q3-06
Q4-06
Q1-07
Q2-07
Q3-07
Q4-07
Identical sales
Comparable sales
Estimated inflation
EXCLUDING FUEL
The Kroger Co. Page 44
0.0%
1.0%
2.0%
3.0%
4.0%
5.0%
6.0%
7.0%
Q1-04
Q2-04
Q3-04
Q4-04
Q1-05
Q2-05
Q3-05
Q4-05
Q1-06
Q2-06
Q3-06
Q4-06
Q1-07
Q2-07
Q3-07
Q4-07
Identical sales
Comparable sales
Estimated inflation