Kroger 2007 Annual Report Download - page 19
Download and view the complete annual report
Please find page 19 of the 2007 Kroger annual report below. You can navigate through the pages in the report by either clicking on the pages listed below, or by using the keyword search tool below to find specific information within the annual report.-
 1
1 -
2
-
3
-
4
-
5
-
6
-
7
-
8
-
 9
9 -
 10
10 -
 11
11 -
 12
12 -
 13
13 -
 14
14 -
 15
15 -
 16
16 -
 17
17 -
 18
18 -
 19
19 -
 20
20 -
 21
21 -
 22
22 -
 23
23 -
 24
24 -
 25
25 -
 26
26 -
 27
27 -
 28
28 -
 29
29 -
30
-
31
-
32
-
33
-
34
-
35
-
36
-
37
-
38
-
39
-
40
-
41
-
42
-
43
-
44
-
45
-
46
-
47
-
48
-
49
-
50
-
51
-
52
-
53
-
54
-
55
 |
 |

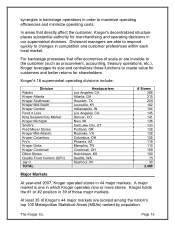
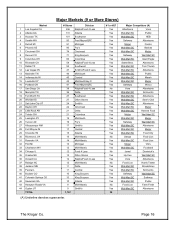
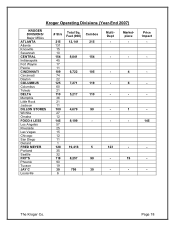
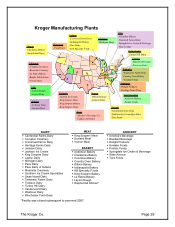
Kroger Operating Divisions (Year-End 2007)
KROGER
DIVISIONS/
Major MSAs
# Strs Total Sq.
Feet (000) Combos Multi-
Dept
Market-
place
Price
Impact
KING SOOPERS 141 8,150 141 - - -
Denver 71
Boulder 10
Colorado Springs 10
MICHIGAN 136 6,985 136 - - -
Detroit 91
Flint 13
MID-ATLANTIC 128 6,221 128 - - -
Richmond 15
Roanoke 14
Charleston WV 12
Raleigh 12
Hampton Roads 9
MID-SOUTH 162 8,504 162 - - -
Nashville 46
Louisville 39
Lexington 19
QFC 75 2,643 75 - - -
Seattle 61
Portland 6
RALPHS 268 11,361 268 - - -
Los Angeles 189
Riverside 33
San Diego 27
Oxnard 11
SMITH’S 133 8,328 128 - 5 -
Las Vegas 32
Salt Lake City 24
Albuquerque 17
Ogden 9
SOUTHWEST 209 11,700 209 - - -
Houston 101
Dallas 53
Fort Worth 27
TOTAL 2,486 144,631 2,183 123 35 145
The Kroger Co. Page 19