Konica Minolta 2007 Annual Report Download - page 58
Download and view the complete annual report
Please find page 58 of the 2007 Konica Minolta annual report below. You can navigate through the pages in the report by either clicking on the pages listed below, or by using the keyword search tool below to find specific information within the annual report.-
 1
1 -
2
-
3
-
4
-
5
-
6
-
7
-
8
-
9
-
10
-
11
-
12
-
13
-
14
-
15
-
16
-
17
-
18
-
19
-
20
-
21
-
22
-
23
-
24
-
25
-
26
-
27
-
28
-
29
-
30
-
31
-
32
-
33
-
34
-
35
-
36
-
37
-
38
-
39
-
40
-
41
-
42
-
43
-
44
-
45
-
46
-
47
-
 48
48 -
 49
49 -
 50
50 -
 51
51 -
 52
52 -
 53
53 -
 54
54 -
 55
55 -
 56
56 -
 57
57 -
 58
58 -
 59
59 -
 60
60 -
 61
61 -
 62
62 -
 63
63 -
 64
64
 |
 |

56
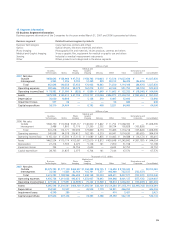
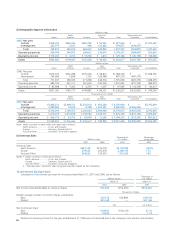
(2) Geographic Segment Information
Millions of yen
North Asia and Eliminations and
Japan America Europe Other Total Corporate Consolidated
2007: Net sales
Outside ¥460,196 ¥246,786 ¥263,702 ¥ 56,945 ¥1,027,630 ¥ — ¥1,027,630
Intersegment 292,774 2,247 969 183,885 479,877 (479,877) —
Total 752,970 249,033 264,672 240,830 1,507,507 (479,877) 1,027,630
Operating expenses 639,740 244,932 254,632 239,016 1,378,321 (454,697) 923,624
Operating income ¥113,230 ¥ 4,100 ¥ 10,040 ¥ 1,814 ¥ 129,186 ¥ (25,179) ¥ 104,006
Assets ¥865,962 ¥179,007 ¥155,426 ¥ 92,420 ¥1,292,817 ¥(341,765) ¥ 951,052
Millions of yen
North Asia Eliminations and
Japan America Europe and Other Total Corporate Consolidated
2006: Net sales
Outside ¥476,720 ¥262,288 ¥270,566 ¥ 58,815 ¥1,068,390 ¥ — ¥1,068,390
Intersegment 294,586 5,898 1,302 185,488 487,276 (487,276) —
Total 771,307 268,186 271,868 244,304 1,555,666 (487,276) 1,068,390
Operating expenses 685,718 261,121 267,633 243,206 1,457,681 (472,706) 984,974
Operating income ¥ 85,588 ¥ 7,065 ¥ 4,235 ¥ 1,097 ¥ 97,985 ¥ (14,569) ¥ 83,415
Assets ¥821,766 ¥183,772 ¥144,887 ¥ 86,231 ¥1,236,657 ¥(292,603) ¥ 944,054
Thousands of U.S. dollars
North Asia Eliminations and
Japan America Europe and Other Total Corporate Consolidated
2007: Net sales
Outside $3,898,314 $2,090,521 $2,233,816 $ 482,380 $ 8,705,040 $ — $8,705,040
Intersegment 2,480,085 19,034 8,208 1,557,687 4,065,032 (4,065,032) —
Total 6,378,399 2,109,555 2,242,033 2,040,068 12,770,072 (4,065,032) 8,705,040
Operating expenses 5,419,229 2,074,816 2,156,984 2,024,701 11,675,739 (3,851,732) 7,824,007
Operating income $ 959,170 $ 34,731 $ 85,049 $ 15,366 $ 1,094,333 $ (213,291) $ 881,033
Assets $7,335,553 $1,516,366 $1,316,612 $ 782,889 $10,951,436 $(2,895,087) $8,056,349
Note: Major countries or areas other than Japan are as follows:
North America ...................U.S.A. and Canada
Europe...............................Germany, France and U.K.
Asia and Other...................Australia, China and Singapore
(3) Overseas Sales Thousands of Percentage
Millions of yen U.S. dollars of net sales
2007 2006 2007 2007
Overseas Sales
North America ¥257,160 ¥274,218 $2,178,399 25.0%
Europe 279,324 281,418 2,366,150 27.2
Asia and Other 204,623 199,529 1,733,359 19.9
Notes: 1. Major countries or areas are as follows:
North America ...............U.S.A. and Canada
Europe...........................Germany, France and U.K.
Asia and Other...............Australia, China and Singapore
2. “Overseas sales” represents sales recognized outside of Japan by the Companies.
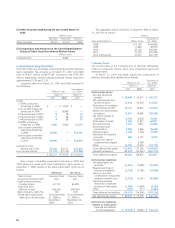
18. Net Income (loss) per share
Calculations of net income per share for the years ended March 31, 2007 and 2006, are as follows. Thousands of
Millions of yen U.S. dollars
March 31 March 31
2007 2006 2007
Net income (loss) attributable to common shares ¥72,542 ¥(54,305) $614,502
Thousands of shares
Weight average number of common shares outstanding:
Basic 530,778 530,898 530,778
Diluted 541,168 —541,168
Yen U.S. dollars
Net income per share:
Basic ¥136.67 ¥(102.29) $1.16
Diluted 134.00 —1.14
Diluted net income per share for the year ended March 31, 2006 was not disclosed due to the company’s loss position (anti-dilutive).