Konica Minolta 2007 Annual Report Download - page 38
Download and view the complete annual report
Please find page 38 of the 2007 Konica Minolta annual report below. You can navigate through the pages in the report by either clicking on the pages listed below, or by using the keyword search tool below to find specific information within the annual report.-
 1
1 -
2
-
3
-
4
-
5
-
6
-
7
-
8
-
9
-
10
-
11
-
12
-
13
-
14
-
15
-
16
-
17
-
18
-
19
-
20
-
21
-
22
-
23
-
24
-
25
-
26
-
27
-
 28
28 -
 29
29 -
 30
30 -
 31
31 -
 32
32 -
 33
33 -
 34
34 -
 35
35 -
 36
36 -
 37
37 -
 38
38 -
 39
39 -
 40
40 -
 41
41 -
 42
42 -
 43
43 -
 44
44 -
 45
45 -
 46
46 -
 47
47 -
 48
48 -
49
-
50
-
51
-
52
-
53
-
54
-
55
-
56
-
57
-
58
-
59
-
60
-
61
-
62
-
63
-
64
 |
 |

36
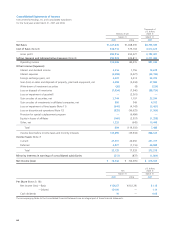
business had a positive affect on the overall profit margin. The weaker yen was an additional
positive earnings factor. As a result, operating income for the fiscal year ended March 2007
increased 24.7% to ¥104.0 billion, while the operating income ratio improved by 2.3 percentage
points from 7.8% to 10.1%.
Net other expenses (income) improved by ¥120.2 billion over the previous fiscal year to a sur-
plus of ¥0.9 billion. The major factors behind this improvement included the absence of (1) a
¥96.6 billion charge for costs related to the decision to exit the Photo Imaging business last
fiscal year, (2) a goodwill amortization charge of ¥2.4 billion related to the prior management
integration, and (3) a provision of ¥6.5 billion for the special outplacement program recorded the
previous fiscal year. For the fiscal year ended March 2007, a gain on the sale of fixed assets of
¥7.3 billion related to the exit from the Photo Imaging business, and gains of ¥2.8 billion on the
sale of investment securities were recorded. In addition, interest expenses declined because of a
reduction in interest-bearing debt.
As a result of the above, income before income taxes and minority interests was ¥104.9 billion
and net income for the period was ¥72.5 billion. Net income per share of common stock was
¥136.67, while ROE (return on equity) was 21.9% and ROA (operating income + interest and div-
idend income return on total assets) was 11.2%.
Liquidity and Financial Position
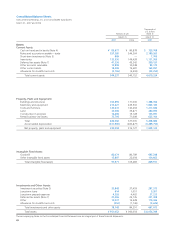
Total Assets, Liabilities and Shareholders’ Equity/Net Assets
Total assets at the end of the fiscal year were ¥7.0 billion higher than at the end of the previous
fiscal year at ¥951.1 billion.
In current assets, notes and accounts receivable–trade increased by ¥11.1 billion due to growth
in sales. In addition, inventories declined by ¥15.9 billion and allowance for doubtful accounts
declined by ¥4.3 billion, mainly as a result of the exit from the Photo Imaging business.
In property, plant and equipment, the book value of mainly machinery and equipment, build-
ings and structures, and land declined by ¥34.9 billion as a result of asset sales related to the
decision to exit the Photo Imaging business. However, as accumulated depreciation also increased
by ¥48.9 billion, the net value of property, plant and equipment increased ¥14.0 billion as a
result of capital expenditures mainly in the Business Technologies and Optics businesses. In other
asset categories, investment securities declined by ¥3.5 billion due to stock liquidations arising
from the sale of stock in affiliated companies and the unwinding of cross-holdings due to the
decision to exit the Photo Imaging business.
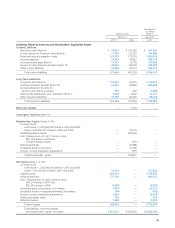
Under liabilities, interest-bearing debt declined by ¥7.2 billion to ¥229.4 billion. Short-term
debt declined by ¥55.4 billion, and the current portion of long-term debt declined by ¥5.0 billion.
On the other hand, long-term debt increased by ¥53.3 billion due to the issuance of convertible
bonds (¥70.3 billion).
In net assets, as net income for the period was ¥72.5 billion, retained earnings increased by
¥95.6 billion. On the other hand, as retained earnings were used to offset the loss at the end
of the previous fiscal year, additional paid-in capital declined by ¥21.9 billion, and unrealized
gains on securities declined by ¥2.7 billion because of the sale of stocks held. As a result of the
above, net assets at the end of the period increased by ¥72.1 billion over the end of the previous
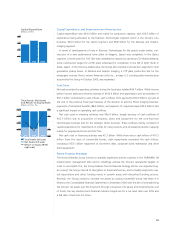
fiscal year, and the equity ratio increased by 7.5 percentage points over the end of the previous
fiscal year to 38.6%.
Equity Ratio
(%)
2005 2006 2007
0
10
20
30
40
Interest Coverage Ratio
(Times)
2005 2006 2007
0
6
12
18
24