Konica Minolta 2007 Annual Report Download - page 39
Download and view the complete annual report
Please find page 39 of the 2007 Konica Minolta annual report below. You can navigate through the pages in the report by either clicking on the pages listed below, or by using the keyword search tool below to find specific information within the annual report.-
 1
1 -
2
-
3
-
4
-
5
-
6
-
7
-
8
-
9
-
10
-
11
-
12
-
13
-
14
-
15
-
16
-
17
-
18
-
19
-
20
-
21
-
22
-
23
-
24
-
25
-
26
-
27
-
28
-
 29
29 -
 30
30 -
 31
31 -
 32
32 -
 33
33 -
 34
34 -
 35
35 -
 36
36 -
 37
37 -
 38
38 -
 39
39 -
 40
40 -
 41
41 -
 42
42 -
 43
43 -
 44
44 -
 45
45 -
 46
46 -
 47
47 -
 48
48 -
 49
49 -
50
-
51
-
52
-
53
-
54
-
55
-
56
-
57
-
58
-
59
-
60
-
61
-
62
-
63
-
64
 |
 |
37
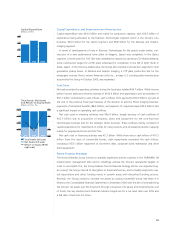
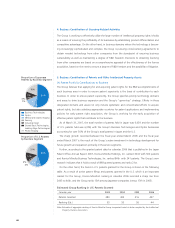
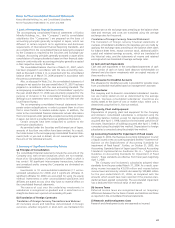
Capital Expenditure, and Depreciation and Amortization
Capital expenditure was ¥64.0 billion and mainly for production capacity, with ¥24.5 billion of
expenditure being allocated to the Business Technologies segment which is the Group’s core
business, ¥24.5 billion for the Optics segment and ¥8.8 billion for the Medical and Graphic
Imaging segment.
In terms of developments of note in Business Technologies for the period under review, con-
struction of a new polymerized toner plant (in Nagano, Japan) was completed. In the Optics
segment, a fourth plant for TAC film was completed to respond to growing LCD related demand,
while construction began for a fifth plant scheduled for completion in the fall of 2007 (both in
Kobe, Japan). In the memory-related area, the Group also invested in production capacity for next
generation pickup lenses. In Medical and Graphic Imaging, a CTP plate production line for the
newspaper industry that is owned American Litho Inc., a major U.S. printing plate manufacturer
acquired by the Group in October 2005, was expanded.
Cash Flows
Net cash provided by operating activities during the fiscal year totaled ¥66.7 billion. While income
before income taxes and minority interests of ¥104.9 billion and depreciation and amortization of
¥52.7 billion contributed to cash inflows, cash outflows from payments (¥30.0 billion) accrued at
the end of the previous fiscal year because of the decision to exit the Photo Imaging business,
payments of retirement benefits (¥8.4 billion), and payment of corporate taxes (¥22.2 billion) had
a significant impact on operating cash outflows.
Net cash used in investing activities was ¥56.4 billion, largely because of cash outflows of
¥62.5 billion due to acquisition of property, plant and equipment for the core Business
Technologies business and for the strategic Optics business. These outflows mainly consisted of
capital expenditure for investments in molds for new products, and increased production capacity
mainly for polymerized toner and TAC film.
Net cash used in financing activities was ¥5.2 billion. While there was a cash inflow of ¥70.3
billion from the issue of convertible bonds, debt repayments exceeded the cash inflow,
including a ¥53.1 billion repayment of short-term debt, corporate bond redemption and other
debt repayments.
Future Financial Strategies
The Konica Minolta Group intends to speedily implement policies outlined in the FORWARD 08
medium-term management plan and to unfailingly achieve the Group’s operational targets, In
order to accomplish this, the Group believes that its financial strategy will be one important key.
As a result, the Group intends to strengthen its financial structure, and to flexibly respond to cap-
ital expenditure and other funding needs in growth areas with diversified funding sources.
Recently, the Group moved to increase net assets by issuing convertible bonds (see Note 6 in
Notes to the Consolidated Financial Statements) in December 2006 with the aim of strengthening
the Group’s net assets over the long term through conversion into equity and minimizing the cost
of funds. Our key medium-term financial indicator targets are for a net asset ratio over 50% and
a D/E ratio of less than 0.5 times.
Capital Expenditure
(Billions of Yen)
0
20
40
60
80
2005 2006 2007
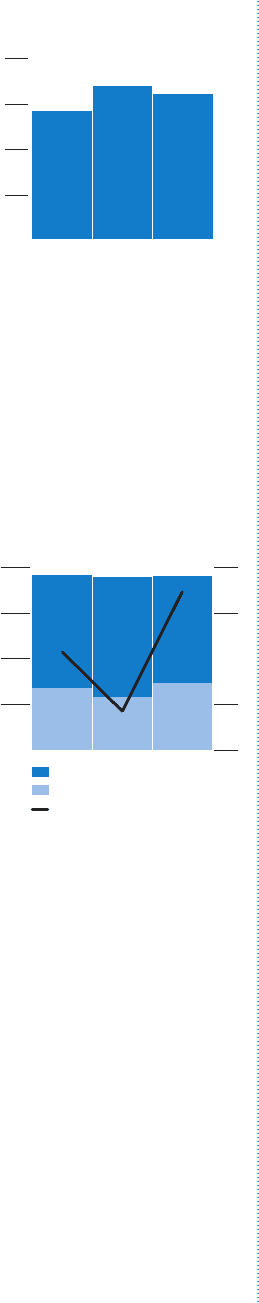
Total Assets
(left scale)
Net Assets
(left scale)
Return on Equity (ROE)
(right scale)
Total Assets, Net Assets
and Return on Equity (ROE)
(Billions of Yen, %)
0
250
500
750
1,000
2005 2006 2007
0
15
30
–30
–15