Konica Minolta 2007 Annual Report Download - page 37
Download and view the complete annual report
Please find page 37 of the 2007 Konica Minolta annual report below. You can navigate through the pages in the report by either clicking on the pages listed below, or by using the keyword search tool below to find specific information within the annual report.-
 1
1 -
2
-
3
-
4
-
5
-
6
-
7
-
8
-
9
-
10
-
11
-
12
-
13
-
14
-
15
-
16
-
17
-
18
-
19
-
20
-
21
-
22
-
23
-
24
-
25
-
26
-
 27
27 -
 28
28 -
 29
29 -
 30
30 -
 31
31 -
 32
32 -
 33
33 -
 34
34 -
 35
35 -
 36
36 -
 37
37 -
 38
38 -
 39
39 -
 40
40 -
 41
41 -
 42
42 -
 43
43 -
 44
44 -
 45
45 -
 46
46 -
 47
47 -
48
-
49
-
50
-
51
-
52
-
53
-
54
-
55
-
56
-
57
-
58
-
59
-
60
-
61
-
62
-
63
-
64
 |
 |

35
R&D on next generation pickup lenses. Medical and Graphic Imaging segment R&D expenditures
were higher than the previous fiscal year at ¥10.5 billion mainly because of R&D expenditures for
digital X-ray image input/output equipment. In addition, R&D expenditures for the Sensing
segment were ¥1.1 billion.
Segment Information
Sales in the Business Technologies segment grew 9% year-on-year to ¥658.7 billion and operat-
ing income increased 23% year-on-year to ¥80.0 billion. This increase reflected sales growth
mainly in European markets on an enhanced product lineup with the introduction of four new
color MFP models, mainly in the medium- and high-speed range. Also contributing to sales was
the introduction of two new models in the production printing area that were specially aimed at
developing the U.S. market, which has the largest market potential.
Sales in the Optics segment increased 26% year-on-year to ¥139.0 billion and operating
income grew 19% year-on-year to ¥21.0 billion. Growth in this segment was supported by
increased sales of TAC and viewing angle expansion film in the display area, given growth in the
LCD TV market and the shift to larger screen sizes. In addition, sales of high value-added optical
pickup lenses were buoyed by growth of DVD readable products, and the contribution from
the second half from sales of next generation products for Blu-ray and HD DVD formats. In the
imaging input/output area, particularly strong growth was recorded in sales of camera units for
camera-equipped mobile phones to major overseas customers. As a result, operating income for
the segment also recorded growth over the previous fiscal year.
Medical and Graphic Imaging segment sales increased 8% year-on-year to ¥158.7 billion, while
operating income for the segment declined 24% year-on-year to ¥8.9 billion. In the medical
imaging area the higher segment sales reflected favorable growth in digital input/output equip-
ment for overseas markets as well as dry film for digital equipment, given an accelerating trend
toward on-site medical digitization and networking. In the graphic imaging area, although the
accelerating trend toward digitization and filmless in printing processes continued, the main line
film products grew in overseas markets. On the other hand, the year-on-year decline in operating
income was due to higher costs for digital equipment development and sharply higher prices for
silver, which is the basic material for film products.
Sensing business sales growth reflected stronger sales of color measuring equipment for the
automobile and FPD industries, and the contribution from the establishment of new independent
sales companies in the U.S., Europe and Singapore. On the other hand, additional costs related to
the establishment of these independent overseas marketing companies resulted in lower oper-
ating income for the year. Sales for the Sensing business increased 72% year-on-year to ¥10.0
billion, while operating income declined 11% year-on-year to ¥1.6 billion.
Sales in the Industrial Inkjet business increased 38% year-on-year to ¥6.0 billion, while oper-
ating income grew 47% year-on-year to ¥1.3 billion. The business recorded good growth in its
second year of full-fledged operations thanks to active efforts to win new customers.
Sales for the Photo Imaging business declined 74% year-on-year to ¥47.8 billion following the
Group’s decision to exit the business in Japan and overseas. However, the operating loss for the
segment improved by ¥6.3 billion from the previous fiscal year to ¥0.8 billion.
Earnings Analysis
The major increase and decrease factors affecting earnings included a large positive contribution
from the Group’s main business segments, while the process of exiting from the Photo Imaging
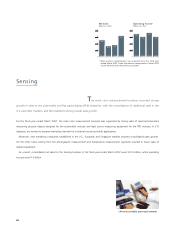
Operating Income
(left scale)
Operating Income Ratio
(right scale)
Operating Income and
Operating Income Ratio
(Billions of Yen, %)
0
30
60
90
120
2005 2006 2007 0
3
6
9
12
Net Income (Loss)
(left scale)
Earnings per Share (EPS)
(right scale)
Net Income (Loss) and
Earnings per Share (EPS)
(Billions of Yen, %)
0
75
150
–80
–40
0
40
80
2005 2006 2007 –150
–75