Konica Minolta 2007 Annual Report Download - page 17
Download and view the complete annual report
Please find page 17 of the 2007 Konica Minolta annual report below. You can navigate through the pages in the report by either clicking on the pages listed below, or by using the keyword search tool below to find specific information within the annual report.-
 1
1 -
2
-
3
-
4
-
5
-
6
-
 7
7 -
 8
8 -
 9
9 -
 10
10 -
 11
11 -
 12
12 -
 13
13 -
 14
14 -
 15
15 -
 16
16 -
 17
17 -
 18
18 -
 19
19 -
 20
20 -
 21
21 -
 22
22 -
 23
23 -
 24
24 -
 25
25 -
 26
26 -
 27
27 -
28
-
29
-
30
-
31
-
32
-
33
-
34
-
35
-
36
-
37
-
38
-
39
-
40
-
41
-
42
-
43
-
44
-
45
-
46
-
47
-
48
-
49
-
50
-
51
-
52
-
53
-
54
-
55
-
56
-
57
-
58
-
59
-
60
-
61
-
62
-
63
-
64
 |
 |

Business Technologies
Optics
Medical and Graphic Imaging
Sensing
Main Products:
MFPs, LBPs, facsimile machines,
consumables, software, system
solutions, service
Main Products:
Optical pickup lenses, lens units,
microcamera units, TAC film for
LCDs, glass substrates for hard disks
Main Products:
X-ray image processing systems,
X-ray film, contrast media for
diagnostic purposes, digital color
proofing systems, graphic film
Main Products:
3-D digitizers, color, and light
measuring instruments, medical
measuring instruments
Industrial Inkjet
Main Products:
Industrial inkjet heads, consumables,
textile printers and others
5.4%
0.6%
1.0%
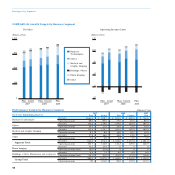
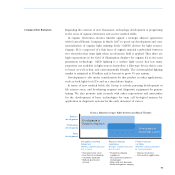
Sales Composition
(Fiscal Year Ended March 2007)
Net Sales by Geographical Region
(Fiscal Year Ended March 2007)
Business
Technologies
Optics
Sensing
Industrial Inkjet
Medical and
Graphic Imaging
Holdings, Others
Japan
North America
Europe
Asia, Other
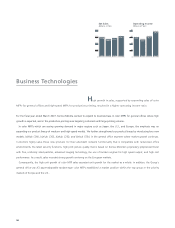
Net Sales
(Billions of Yen)
0
200
400
600
800
625.8 564.8 606.7
2007200620052004
0
40
80
120
160
120.9 129.9 146.6
2007200620052004
0
3
6
9
12
8.0
5.3 5.8
2007200620052004
0
1.5
3.0
4.5
6.0
0.8
4.4
200720062005
Net Sales
(Billions of Yen)
Net Sales
(Billions of Yen)
Net Sales
(Billions of Yen)
Net Sales
(Billions of Yen)
0
40
80
120
160
85.8 91.7 110.4
658.7
158.7
10.0
6.0
139.0
2006 200720052004
27.9%
27.2%
25.0%
19.9%
64.1%
13.5%
15.4%
15
At a Glance