Konica Minolta 2007 Annual Report Download - page 36
Download and view the complete annual report
Please find page 36 of the 2007 Konica Minolta annual report below. You can navigate through the pages in the report by either clicking on the pages listed below, or by using the keyword search tool below to find specific information within the annual report.-
 1
1 -
2
-
3
-
4
-
5
-
6
-
7
-
8
-
9
-
10
-
11
-
12
-
13
-
14
-
15
-
16
-
17
-
18
-
19
-
20
-
21
-
22
-
23
-
24
-
25
-
 26
26 -
 27
27 -
 28
28 -
 29
29 -
 30
30 -
 31
31 -
 32
32 -
 33
33 -
 34
34 -
 35
35 -
 36
36 -
 37
37 -
 38
38 -
 39
39 -
 40
40 -
 41
41 -
 42
42 -
 43
43 -
 44
44 -
 45
45 -
 46
46 -
47
-
48
-
49
-
50
-
51
-
52
-
53
-
54
-
55
-
56
-
57
-
58
-
59
-
60
-
61
-
62
-
63
-
64
 |
 |

34
Consolidated Financial Review
Scope of Consolidated Financial Statements
The Konica Minolta Group comprises Konica Minolta Holdings, Inc., and its 120 subsidiaries, 25
unconsolidated subsidiaries and 9 affiliated companies.
The business segments of the Group are organized and segmented by type of product, the
markets in which these products are sold and the nature of the business or how it is adminis-
tered. The Group’s six business segments are Business Technologies, Optics, Medical and Graphic
Imaging, Sensing, Industrial Inkjet, and Photo Imaging. In addition, the Group nearly completed
its exit from the Photo Imaging business in the fiscal year ended March 2007.
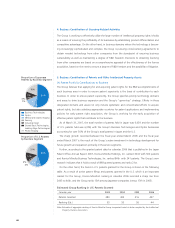
Consolidated Business Results
Consolidated Net Sales
Consolidated net sales for the fiscal year ended March 2007 declined by ¥40.8 billion year-on-year
to ¥1,027.6 billion. While sales in the Photo Imaging business that is being wound down recorded
a large decline of ¥139.4 billion for the year, growth was recorded in sales for all other businesses.
In particular, sales for the strategic Optics business recorded 26% year-on-year growth.
In the Business Technologies business, good growth of medium- and high-speed color MFPs
mainly in European markets supported 9% growth in sales for the segment as a whole. In the
Optics business, all areas recorded good sales growth, including TAC film and viewing angle
expansion film for display applications, optical pickup lenses and glass hard disk substrates for
memory applications, micro cameras for camera-equipped mobile phones for imaging input/out-
put applications. In the Medical and Graphic Imaging business, digital X-ray input/output equip-
ment for medical imaging area and overseas film sales for the graphic imaging area recorded 8%
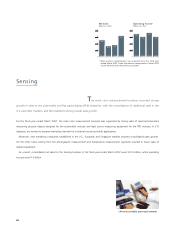
year-on-year growth. In the Sensing business, strong sales were recorded for color measuring
equipment used in automobile and FPD industries. In the Industrial Inkjet business, favorable sales
were supported by active development of new customers. On the other hand, sales in the Photo
Imaging business recorded a noticeable decline because of the Group’s decision to exit this
business in Japan and overseas.
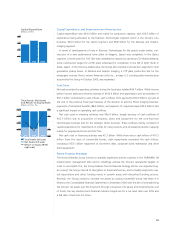
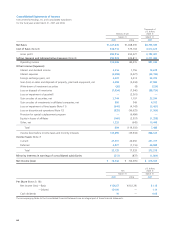
Cost of Sales, and Selling, General and Administrative Expenses
The cost of sales for the fiscal year was ¥532.7 billion, resulting in a cost of sales ratio of 51.8%.
The Group was able to offset sharply higher silver and other basic materials costs and unit price
declines because of more intense competition with Group-wide cost reduction efforts and an
improved sales mix with the introduction of new products, and the effect of foreign exchange
rates. As a result, gross profit was ¥494.9 billion, and the gross profit margin improved by 2
percentage points over the previous year, from 46.2% to 48.2%.
Selling, general and administrative expenses were reduced by ¥48.7 billion because of the exit
from the Photo Imaging business. As a result, total selling, general and administrative expenses
declined by ¥18.9 billion from the previous fiscal year to ¥390.9 billion, even though selling and
research expenses for other businesses increased by ¥29.8 billion.
Research and Development Expenses
Research and development expenditures rose ¥5.0 billion over the previous fiscal year to ¥72.1
billion. In the Business Technologies segment, R&D expenditures rose over the previous fiscal year
to ¥42.5 billion, mainly because of expenditures for the development of new medium- and high-
speed color MFP products and R&D on software and applications to establish the capability to
provide solutions. In the Optics segment, R&D expenditures of ¥9.8 billion were used largely for
Business Technologies
Optics
Medical and Graphic Imaging
Sensing, Industrial Inkjet
Holdings, Others
Photo Imaging
Net Sales
(Billions of Yen)
0
300
600
900
1,200
2005 2006 2007
Cost of Sales
(left scale)
Cost of Sales Ratio
(right scale)
Cost of Sales and
Cost of Sales Ratio
(Billions of Yen, %)
0
15
30
45
60
0
200
400
600
800
2005 2006 2007