Konica Minolta 2007 Annual Report Download - page 48
Download and view the complete annual report
Please find page 48 of the 2007 Konica Minolta annual report below. You can navigate through the pages in the report by either clicking on the pages listed below, or by using the keyword search tool below to find specific information within the annual report.-
 1
1 -
2
-
3
-
4
-
5
-
6
-
7
-
8
-
9
-
10
-
11
-
12
-
13
-
14
-
15
-
16
-
17
-
18
-
19
-
20
-
21
-
22
-
23
-
24
-
25
-
26
-
27
-
28
-
29
-
30
-
31
-
32
-
33
-
34
-
35
-
36
-
37
-
 38
38 -
 39
39 -
 40
40 -
 41
41 -
 42
42 -
 43
43 -
 44
44 -
 45
45 -
 46
46 -
 47
47 -
 48
48 -
 49
49 -
 50
50 -
 51
51 -
 52
52 -
 53
53 -
 54
54 -
 55
55 -
 56
56 -
 57
57 -
 58
58 -
59
-
60
-
61
-
62
-
63
-
64
 |
 |

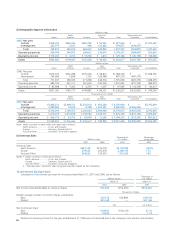
46
Thousands of
U.S. dollars
Millions of yen (Note 3)
March 31 March 31
2007 2006 2007
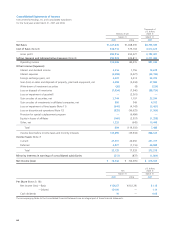
Cash Flows from Operating Activities:
Income (loss) before income taxes and minority interests ¥104,890 ¥(35,934) $888,522
Depreciation and amortization 52,692 51,198 446,353
Loss on impairment of fixed assets 640 4,143 5,421
Amortization of goodwill 6,476 5,595 54,858
Increase (decrease) in allowance for doubtful accounts (4,378) 465 (37,086)
Interest and dividend income (2,316) (1,756) (19,619)
Interest expenses 5,088 5,427 43,100
Loss (gain) on sales and disposals of tangible fixed assets (4,484) 2,434 (37,984)
Gain on sale and write-down of securities (2,717) (1,099) (23,016)
Gain on sales of investment in affiliated companies (580) —(4,913)
Decrease in accrued retirement benefits (8,383) —(71,012)
Decrease in reserve for discontinued operations (29,980) —(253,960)
Loss on impairment of goodwill —2,361 —
Loss on discontinued operations 935 96,625 7,920
Provision for special outplacement program —6,484 —
(Increase) decrease in trade notes and accounts receivable (976) 7,257 (8,268)
Decrease in inventories 19,262 22,032 163,168
Decrease in trade notes and accounts payable (5,064) (31,855) (42,897)
Increase (decrease) in accrued consumption tax payable (1,969) 400 (16,679)
Reversal of reserve for loss on impairment of leased assets (3,129) —(26,506)
Transfer of rental business-use assets (10,168) (11,278) (86,133)
Other (17,700) (9,449) (149,936)
Subtotal 98,137 113,051 831,317
Interest and dividend income received 2,473 1,524 20,949
Interest paid (5,220) (5,488) (44,219)
Payment for special outplacement program (6,484) —(54,926)
Income taxes paid (22,193) (30,162) (187,997)
Net cash provided by operating activities 66,712 78,924 565,116
Cash Flows from Investing Activities:
Payment for acquisition of tangible fixed assets (62,517) (51,904) (529,581)
Proceeds from sale of tangible fixed assets 12,064 5,551 102,194
Payment for acquisition of intangible fixed assets (6,703) (8,809) (56,781)
Proceeds from sale of subsidiaries —8,599 —
Payment for acquisition of additional shares of consolidated subsidiaries (2,744) —(23,244)
Proceeds from sales of investments in consolidated subsidiaries 1,744 —14,773
Payment for acquisition of newly consolidated subsidiaries —(1,729) —
Payment for loans receivable (891) (541) (7,548)
Proceeds from collection of loan receivable 1,142 1,556 9,674
Payment for acquisition of investment securities (1,411) (42) (11,953)
Proceeds from sales of investment securities 3,461 5,057 29,318
Payment for other investments (2,129) (3,236) (18,035)
Other 1,585 2,352 13,427
Net cash used in investing activities (56,401) (43,146) (477,772)
Cash Flows from Financing Activities:
Net decrease in short-term loans payable (53,125) (25,819) (450,021)
Proceeds from long-term loans payable —27,502 —
Repayment of long-term loans payable (8,079) (7,396) (68,437)
Proceeds from issuance of bonds 70,300 9,184 595,510
Redemption of bonds (14,002) (17,536) (118,611)
Proceeds from disposal of treasury stock 910 76
Payment for purchase of treasury stock (190) (135) (1,609)
Dividend paid (12) (2,661) (102)
Dividend paid to minority shareholders in consolidated subsidiaries (70) —(593)
Net cash used in financing activities (5,170) (16,850) (43,795)
Effect of exchange rate changes on cash and cash equivalents 322 2,463 2,728
Increase in cash and cash equivalents 5,463 21,391 46,277
Cash and cash equivalents at the beginning of the year 80,878 59,485 685,116
Increase in cash and cash equivalents due to newly
consolidated subsidiaries 245 12,075
Cash and cash equivalents at the end of the year ¥86,587 ¥80,878 $733,477
The accompanying Notes to the Consolidated Financial Statements are an integral part of these financial statements.
Consolidated Statements of Cash Flows
Konica Minolta Holdings, Inc. and Consolidated Subsidiaries
For the fiscal years ended March 31, 2007 and 2006