Konica Minolta 2007 Annual Report Download - page 10
Download and view the complete annual report
Please find page 10 of the 2007 Konica Minolta annual report below. You can navigate through the pages in the report by either clicking on the pages listed below, or by using the keyword search tool below to find specific information within the annual report.-
 1
1 -
 2
2 -
 3
3 -
 4
4 -
 5
5 -
 6
6 -
 7
7 -
 8
8 -
 9
9 -
 10
10 -
 11
11 -
 12
12 -
 13
13 -
 14
14 -
 15
15 -
 16
16 -
 17
17 -
 18
18 -
 19
19 -
 20
20 -
 21
21 -
22
-
23
-
24
-
25
-
26
-
27
-
28
-
29
-
30
-
31
-
32
-
33
-
34
-
35
-
36
-
37
-
38
-
39
-
40
-
41
-
42
-
43
-
44
-
45
-
46
-
47
-
48
-
49
-
50
-
51
-
52
-
53
-
54
-
55
-
56
-
57
-
58
-
59
-
60
-
61
-
62
-
63
-
64
 |
 |
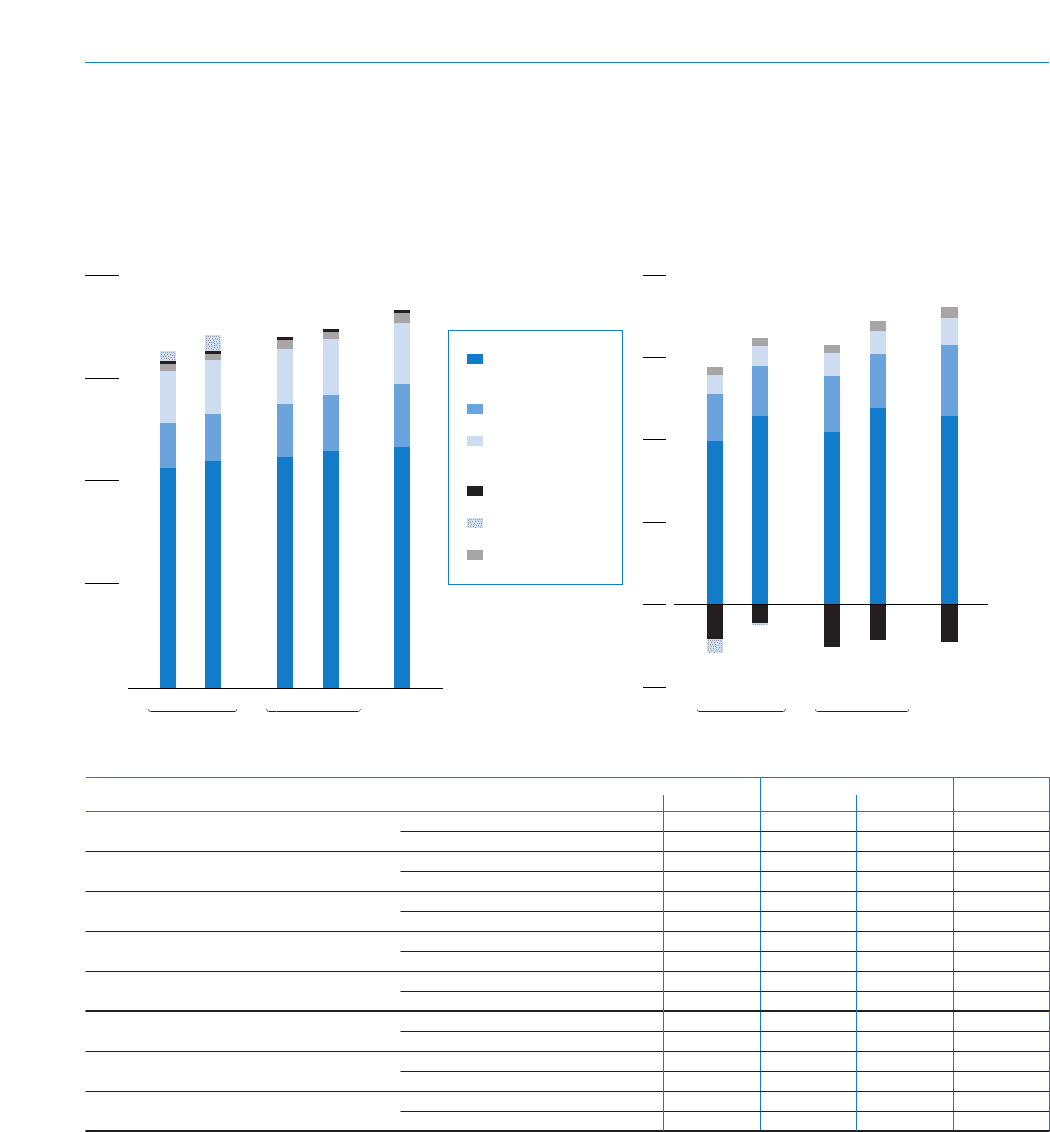
08
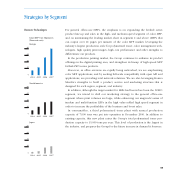
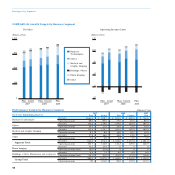
Net Sales Operating Income (Loss)
Other
Photo Imaging
Holdings, Others
Optics
Medical and
Graphic Imaging
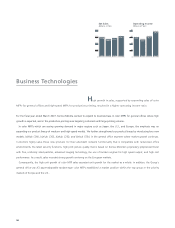
Business
Technologies
ActualPlan
(Billions of Yen) (Billions of Yen)
2007
CurrentPlan
2008
Plan
2009
ActualPlan
2007
CurrentPlan
2008
Plan
2009
0
1,200
900
600
300
–35
140
105
70
35
0
Strategies by Segment
Fiscal Years Ended/Ending March 31
Net sales
Operating income
Net sales
Operating income
Net sales
Operating income
Net sales
Operating income
Net sales
Operating income
Net sales
Operating income (loss)
Net sales
Operating income (loss)
Net sales
Operating income
2009
Plan
Business Technologies
Optics
Medical and Graphic Imaging
Other
Segment Total
Photo Imaging
Holdings, Others, Elimination and Corporate
Group Total
CurrentPlanActual
20082007
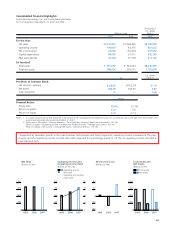
Performance Targets by Business Segment (Billions of Yen)
¥ 700.0
80.0
185.0
30.0
180.0
12.0
26.0
4.0
1,091.0
126.0
0
0
9.0
(16.0)
1,100.0
110.0
¥ 690.0
83.0
163.0
23.0
165.0
10.5
19.0
3.5
1,037.0
120.0
0
0
8.0
(15.0)
1,045.0
105.0
¥ 670.0
73.0
155.0
24.0
165.0
10.0
22.0
3.2
1,012.0
110.2
0
0
8.0
(18.2)
1,020.0
92.0
¥ 658.7
80.0
139.0
21.0
158.7
8.9
16.0
2.9
972.4
112.8
47.8
(0.8)
7.4
(8.0)
1,027.6
104.0
Plan
¥640.0
69.0
130.0
20.0
155.0
8.5
17.0
3.0
942.0
100.5
30.0
(6.0)
8.0
(14.5)
980.0
80
FORWARD 08 Growth Targets by Business Segment