Konica Minolta 2007 Annual Report Download - page 3
Download and view the complete annual report
Please find page 3 of the 2007 Konica Minolta annual report below. You can navigate through the pages in the report by either clicking on the pages listed below, or by using the keyword search tool below to find specific information within the annual report.-
 1
1 -
 2
2 -
 3
3 -
 4
4 -
 5
5 -
 6
6 -
 7
7 -
 8
8 -
 9
9 -
 10
10 -
 11
11 -
 12
12 -
 13
13 -
 14
14 -
15
-
16
-
17
-
18
-
19
-
20
-
21
-
22
-
23
-
24
-
25
-
26
-
27
-
28
-
29
-
30
-
31
-
32
-
33
-
34
-
35
-
36
-
37
-
38
-
39
-
40
-
41
-
42
-
43
-
44
-
45
-
46
-
47
-
48
-
49
-
50
-
51
-
52
-
53
-
54
-
55
-
56
-
57
-
58
-
59
-
60
-
61
-
62
-
63
-
64
 |
 |

01
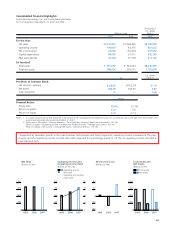
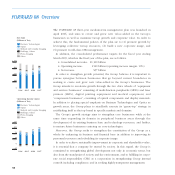
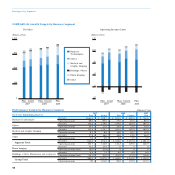
Consolidated Financial Highlights
Konica Minolta Holdings, Inc. and Consolidated Subsidiaries
For the fiscal years ended March 31, 2007 and 2006
For the Year:
Net sales
Operating income
Net income (loss)
Capital expenditure
R&D expenditures
At Year-End:
Total assets
Total net assets
¥1,068,390
83,416
(54,306)
67,571
67,178
¥ 944,054
296,571
2007 2006
Millions of yen
Thousands of
U.S. dollars
(Note 1)
2007
Per Share of Common Stock:
Net income—primary
Net assets
Cash dividends
¥(102.29)
553.50
—
Yen
U.S. dollars
(Note 1)
Financial Ratios:
Equity ratio
Return on assets
Return on equity
31.1%
9.0
(17.1)
Percent
Notes: 1. U.S. dollar amounts above and elsewhere in this report for the Company are translated from yen, for convenience only, at the rate of ¥118.05=US$1, the
approximate exchange rate prevailing at March 31, 2007.
2. Equity ratio = (Net assets – Minority interests) ÷ (Total Liabilities, minority interests and net assets) × 100 (%)
Return on assets = (Operating income + Interest and dividend income) ÷ Average total assets × 100 (%)
Return on equity = Net income ÷ Average (Net assets – Minority interests) × 100 (%)
*Supported by favorable growth in the main Business Technologies and Optics segments, operating income increased 24.7% year-
on-year and the operating income to total sales ratio improved 2.3 percentage points to 10.1% as operating income recorded a
new historical high.
¥1,027,631
104,007
72,542
64,000
72,142
¥ 951,052
368,624
$8,705,040
881,033
614,502
542,143
611,114
$8,056,349
3,122,609
¥136.67
692.39
10
$1.16
5.87
0.08
38.6%
11.2
21.9
*
Total assets
Net assets
Operating income
(left scale)
Operating income Ratio
(right scale)
2005 2006 2007
Net Sales
(Billions of Yen)
2005 2006 2007
Total Assets and
Net Assets
(Billions of Yen)
0
300
600
900
1,200
0
300
600
900
1,200
2005 2006 2007
Operating Income and
Operating Income Ratio
(Billions of Yen, %)
0
30
60
90
120
0
3
6
9
12
2005 2006 2007
Net Income (Loss)
(Billions of Yen)
–80
–40
0
40
80