Konica Minolta 2007 Annual Report Download - page 53
Download and view the complete annual report
Please find page 53 of the 2007 Konica Minolta annual report below. You can navigate through the pages in the report by either clicking on the pages listed below, or by using the keyword search tool below to find specific information within the annual report.-
 1
1 -
2
-
3
-
4
-
5
-
6
-
7
-
8
-
9
-
10
-
11
-
12
-
13
-
14
-
15
-
16
-
17
-
18
-
19
-
20
-
21
-
22
-
23
-
24
-
25
-
26
-
27
-
28
-
29
-
30
-
31
-
32
-
33
-
34
-
35
-
36
-
37
-
38
-
39
-
40
-
41
-
42
-
 43
43 -
 44
44 -
 45
45 -
 46
46 -
 47
47 -
 48
48 -
 49
49 -
 50
50 -
 51
51 -
 52
52 -
 53
53 -
 54
54 -
 55
55 -
 56
56 -
 57
57 -
 58
58 -
 59
59 -
 60
60 -
 61
61 -
 62
62 -
 63
63 -
64
 |
 |

51
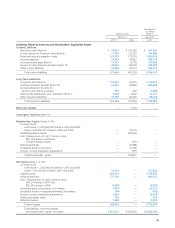
Net deferred tax assets are included in the following items in
the consolidated balance sheets:
Thousands of
Millions of yen U.S. dollars
March 31 March 31
2007 2006 2007
Current assets –
deferred tax assets ¥41,336 ¥43,242 $350,157
Fixed assets –
deferred tax assets 27,306 29,135 231,309
Current liabilities –
other current liabilities (21) (3) (178)
Long-term liabilities –
other long-term liabilities ¥ (2,191) ¥ (2,097) $ (18,560)
Net deferred tax assets ¥66,430 ¥70,276 $562,728
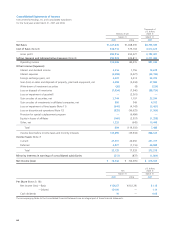
At March 31, 2007 and 2006, the reconciliation of the statutory
income tax rate to the effective income tax rate is as follows:
2007 2006
Statutory income tax rate 40.7% 40.7%
(Reconciliation)
Valuation allowance (9.3) (95.0)
Tax credits (2.6) 6.5
Non-taxable income (0.7) —
Difference in statutory tax rates
of foreign subsidiaries (0.3) —
Expenses not deductible for
tax purposes 1.7 —
Amortization of goodwill 1.9 (9.0)
Other, net (0.8) 8.0
Effective income tax rate per
consolidated statements of income 30.6% (48.8)%
8. Research and Development Costs
Research and development costs included in cost of sales and
selling, general and administrative expenses for the year ended
March 31, 2007 and 2006 are ¥72,142 million (US$611,114
thousand) and ¥67,178 million, respectively.
9. Net Assets
The Japanese Corporate Law effective from May 1, 2006 provides
that earnings in an amount equal to 10% of dividends of retained
earnings shall be appropriated as a capital surplus or a legal
reserve on the date of distribution of retained earnings until the
aggregated amount of capital surplus and legal reserve equals
25% of stated capital. The legal reserve is included in retained
earnings in the accompanying consolidated balance sheets. The
Japanese Commercial Code, effective until the enforcement of the
Japanese Corporate Law, provided that earnings in an amount
equal to at least 10% of appropriations of retained earnings that
were paid in cash shall be appropriated as a legal reserve until the
aggregated amount of capital surplus and legal reserve equaled
25% of stated capital.
The Board of Directors decided not to pay cash dividend for the
interim period ended September 30, 2006, due to the considerable
extraordinary losses incurred in the previous year in connection
with the exit from the Photo Imaging business.
On May 10, 2007, the Board of Directors approved cash divi-
dends to be paid to shareholders of record as of March 31, 2007,
totaling ¥5,307 million, at a rate of ¥10 per share.
10. Contingent Liabilities
The Companies were contingently liable at March 31, 2007 for
loan and lease guarantees of ¥2,236 million (US$18,941 thou-
sand) and as of March 31, 2006 for loan and lease guarantees of
¥2,620 million.
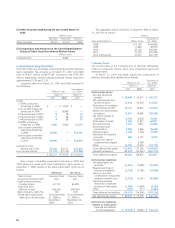
11. Loss on Impairment of Fixed Assets
The Companies have recognized loss on impairment of ¥640 mil-
lion ($5,421 thousand), for the following groups of assets as of
March 31, 2007 and 2006:
Description Classification Amount
Thousands of
Millions of yen U.S. dollars
March 31 March 31
2007 2006 2007
Rental assets Land, ¥— ¥ 4,412 $—
Buildings and
structures
Rental business-
use assets 117 —991
Idle assets Land, 522 287 4,422
Buildings and
structures, Others
Manufacturing Buildings and —24,756 —
and sales of structures,
photographic Machinery and
paper, Film, equipment,
etc. Tools and
furniture, Others
Manufacturing Land, —3,296 —
and sales of Buildings and
except above structures
Total ¥640 ¥32,752 $5,421
(1) Identifying the cash-generating unit to which an asset belongs
Each cash-generating unit is identified based on the product
line and geographical area as a group of assets. For rental
assets, cash-generating unit is identified by the rental contract
and the geographical area. Each idle assets is also identified as
a cash-generating unit.
(2) The events and circumstances that led to the recognition of
the impairment loss
Due to the decline in real estate value and poor perfor-
mance, profitability of rental and idle assets has worsened.
Therefore, the Companies have marked the assets down
to the recoverable value.
(3) Details of Impairment of fixed assets Amount
Thousands of
Millions of yen U.S. dollars
March 31 March 31
2007 2006 2007
Buildings and structures ¥ 87 ¥13,464 $ 737
Rental business-use assets 117 —991
Machinery and equipment —11,006 —
Tools and furniture —1,539 —
Leased asset —3,972 —
Others 435 2,769 3,685
(4) Measuring recoverable amount
The recoverable amount of a cash-generating unit is the fair
value less costs to sell. It is supported by an appraisal report
for land and buildings and structures, or the rational estimate
for rental business–use assets.
12. Loss on Discontinued Operations
In the fiscal year ended March 31, 2006, the Companies recorded
¥96,625 million of loss on discontinued operations, which was
incurred in connection with the exit from the Photo Imaging
business.
This loss included a reserve for discontinued operations
(¥58,078 million), impairment loss on fixed assets of Photo
Imaging business (¥28,609 million) and the cost for disposal of
inventories (¥18,536 million), less the proceeds from the sale of
business (–¥8,599 million).