JetBlue Airlines 2006 Annual Report Download - page 45
Download and view the complete annual report
Please find page 45 of the 2006 JetBlue Airlines annual report below. You can navigate through the pages in the report by either clicking on the pages listed below, or by using the keyword search tool below to find specific information within the annual report.-
 1
1 -
2
-
3
-
4
-
5
-
6
-
7
-
8
-
9
-
10
-
11
-
12
-
13
-
14
-
15
-
16
-
17
-
18
-
19
-
20
-
21
-
22
-
23
-
24
-
25
-
26
-
27
-
28
-
29
-
30
-
31
-
32
-
33
-
34
-
 35
35 -
 36
36 -
 37
37 -
 38
38 -
 39
39 -
 40
40 -
 41
41 -
 42
42 -
 43
43 -
 44
44 -
 45
45 -
 46
46 -
 47
47 -
 48
48 -
 49
49 -
 50
50 -
 51
51 -
 52
52 -
 53
53 -
 54
54 -
 55
55 -
56
-
57
-
58
-
59
-
60
-
61
-
62
-
63
-
64
-
65
-
66
-
67
-
68
-
69
-
70
-
71
-
72
-
73
-
74
-
75
-
76
-
77
-
78
-
79
-
80
-
81
-
82
-
83
-
84
-
85
-
86
-
87
-
88
-
89
-
90
-
91
-
92
-
93
-
94
-
95
-
96
-
97
-
98
-
99
-
100
-
101
-
102
-
103
-
104
 |
 |

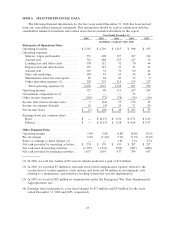
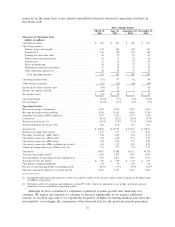
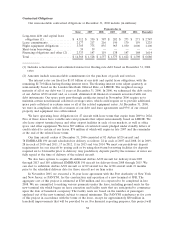
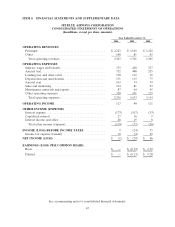
prepared on the same basis as the audited consolidated financial statements appearing elsewhere in
this Form 10-K.
Three Months Ended
March 31,
2006
June 30,
2006
September 30,
2006
December 31,
2006
Statements of Operations Data
(dollars in millions)
Operating revenues .................................. $ 490 $ 612 $ 628 $ 633
Operating expenses:
Salaries, wages and benefits ........................... 132 134 140 147
Aircraft fuel...................................... 160 192 212 188
Landing fees and other rents .......................... 38 37 42 41
Depreciation and amortization ......................... 34 37 39 41
Aircraft rent...................................... 22 25 27 29
Sales and marketing ................................ 20 30 27 27
Maintenance materials and repairs ...................... 21 23 23 20
Other operating expenses (1) .......................... 88 87 77 76
Total operating expenses ........................... 515 565 587 569
Operating income (loss) ............................... (25) 47 41 64
Other income (expense) ............................... (22) (22) (40) (34)
Income (loss) before income taxes ........................ (47) 25 1 30
Income tax expense (benefit) ........................... (15) 11 1 13
Net income (loss).................................... $ (32) $ 14 $ — $ 17
Operating margin.................................... (5.2)%7.7%6.6%10.2%
Pre-tax margin...................................... (9.7)%4.1%0.2%4.7%
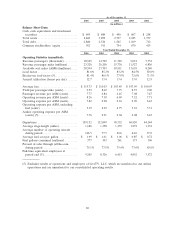
Operating Statistics:
Revenue passengers (thousands) ......................... 4,335 4,525 4,773 4,932
Revenue passenger miles (millions) ....................... 5,536 5,924 6,062 5,798
Available seat miles (ASMs) (millions)..................... 6,577 7,202 7,537 7,278
Load factor ........................................ 84.2%82.2%80.4%79.7%
Breakeven load factor (2) .............................. 92.7%79.5%79.7%76.0%
Aircraft utilization (hours per day) ....................... 12.8 13.0 12.7 12.5
Average fare ....................................... $ 106.86 $ 127.87 $ 123.41 $ 120.01
Yield per passenger mile (cents) ......................... 8.37 9.77 9.72 10.21
Passenger revenue per ASM (cents)....................... 7.04 8.03 7.82 8.13
Operating revenue per ASM (cents) ...................... 7.46 8.48 8.33 8.71
Operating expense per ASM (cents) ...................... 7.84 7.83 7.79 7.82
Operating expense per ASM, excluding fuel (cents)............ 5.40 5.17 4.98 5.24
Airline operating expense per ASM (cents) (2) ............... 7.76 7.77 7.74 7.75
Departures ........................................ 34,417 37,688 42,311 44,736
Average stage length (miles) ............................ 1,246 1,253 1,181 1,087
Average number of operating aircraft during period ........... 95.5 102.6 112.0 115.8
Average fuel cost per gallon ............................ $ 1.86 $ 2.06 $ 2.12 $ 1.92
Fuel gallons consumed (millions) ......................... 86 93 100 98
Percent of sales through jetblue.com during period ............ 82.3%79.5%78.7%76.2%
Full-time equivalent employees at period end (2) ............. 9,039 9,337 9,223 9,265
(1) During the third and fourth quarters of 2006, we sold five Airbus A320 aircraft, which resulted in gains of $7 million and
$5 million, respectively.
(2) Excludes results of operations and employees of LiveTV, LLC, which are unrelated to our airline operations and are
immaterial to our consolidated operating results.
Although we have continued to experience significant revenue growth, this trend may not
continue. We expect our expenses to continue to increase significantly as we acquire additional
aircraft, as our fleet ages and as we expand the frequency of flights in existing markets and enter into
new markets. Accordingly, the comparison of the financial data for the quarterly periods presented
35