JetBlue Airlines 2006 Annual Report Download - page 40
Download and view the complete annual report
Please find page 40 of the 2006 JetBlue Airlines annual report below. You can navigate through the pages in the report by either clicking on the pages listed below, or by using the keyword search tool below to find specific information within the annual report.-
 1
1 -
2
-
3
-
4
-
5
-
6
-
7
-
8
-
9
-
10
-
11
-
12
-
13
-
14
-
15
-
16
-
17
-
18
-
19
-
20
-
21
-
22
-
23
-
24
-
25
-
26
-
27
-
28
-
29
-
 30
30 -
 31
31 -
 32
32 -
 33
33 -
 34
34 -
 35
35 -
 36
36 -
 37
37 -
 38
38 -
 39
39 -
 40
40 -
 41
41 -
 42
42 -
 43
43 -
 44
44 -
 45
45 -
 46
46 -
 47
47 -
 48
48 -
 49
49 -
 50
50 -
51
-
52
-
53
-
54
-
55
-
56
-
57
-
58
-
59
-
60
-
61
-
62
-
63
-
64
-
65
-
66
-
67
-
68
-
69
-
70
-
71
-
72
-
73
-
74
-
75
-
76
-
77
-
78
-
79
-
80
-
81
-
82
-
83
-
84
-
85
-
86
-
87
-
88
-
89
-
90
-
91
-
92
-
93
-
94
-
95
-
96
-
97
-
98
-
99
-
100
-
101
-
102
-
103
-
104
 |
 |
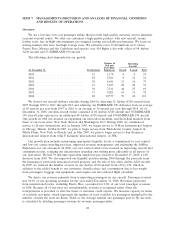
of capacity from transcontinental flights to short- and medium-haul routes, contributed to our
improved financial performance in 2006.
Our ability to be profitable in this competitive environment depends on, among other things,
operating at costs equal to or lower than those of our competitors, providing high quality customer
service and maintaining adequate liquidity levels. Although we have been able to raise capital and
continue to grow, the highly competitive nature of the airline industry could prevent us from attaining
the passenger traffic or yields required to be profitable in new and existing markets.
The highest levels of traffic and revenue on our routes to and from Florida are generally realized
from October through April, and on our routes to and from the western United States in the summer.
Many of our areas of operations in the Northeast experience bad weather conditions in the winter,
causing increased costs associated with deicing aircraft, cancelled flights and accommodating displaced
passengers. Our Florida and Caribbean routes experience bad weather conditions in the summer and
fall due to thunderstorms and hurricanes. As we enter new markets, we could be subject to additional
seasonal variations along with competitive responses to our entry by other airlines. Given our high
proportion of fixed costs, this seasonality may cause our results of operations to vary from quarter to
quarter.
Outlook for 2007
Our focus in 2007 will continue to be on rigorous cost control and enhancing our revenue
management processes. Through our recent efforts to optimize our fare structure and utilize global
distribution systems that attract more business travelers, we expect the year-over-year upward trend in
yield and RASM to continue through 2007. In addition, we are continuously looking to expand our
other revenue opportunities, including charter services and marketing alliances.
We expect our full-year operating capacity for 2007 to increase approximately 11%to 14%over
2006 with the addition of 12 new Airbus A320 aircraft and 10 new EMBRAER 190 aircraft to our
operating fleet. In our efforts to create a growth plan that is sustainable, we may modify our rate of
growth over the next few years through a combination of additional aircraft sales, leases, assignments
and/or delivery deferrals. The impact of the shorter range EMBRAER 190 aircraft, which is expected
to represent 10%of our total estimated 2007 operating capacity, and utilization of our Airbus A320
fleet for more short- and medium-haul flying is expected to result in a 7%decrease over our 2006
average stage length. While the shorter average stage length will result in higher unit costs, we expect
the increase in unit revenues to be higher than the increase in unit costs. Assuming fuel prices of
$1.93 per gallon, net of effective hedges, our cost per available seat mile for 2007 is expected to
increase by 5%to 7%over 2006. Our operating margin is expected to be between 10%and 12%and
our pre-tax margin is expected to be between 5%and 7%for the full year.
Results of Operations
The U.S. domestic airline environment continues to be extremely challenging primarily due to
high aircraft fuel prices and vigorous price competition. Our results were further impacted by the
effects of overall lower demand for domestic air travel and security concerns related to the
August 2006 terrorist threat in London. However, due to capacity reductions in the U.S. domestic
market and the optimization of our own fare mix, average fares for the year increased 9%over 2005
to $119.73, while load factor declined 3.6 points to 81.6%from the full year 2005.
Our on-time performance, defined by the U.S. Department of Transportation as arrivals within
14 minutes of schedule, was 72.9%in 2006 compared to 71.4%in 2005. Our on-time performance was
affected by our commitment to operate our scheduled flights whenever possible, along with operating
at three of the most congested and delay-prone airports in the U.S., as reflected by our 99.6%and
99.2%completion factors in 2006 and 2005, respectively.
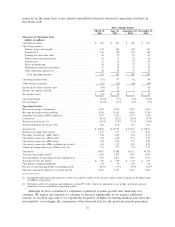
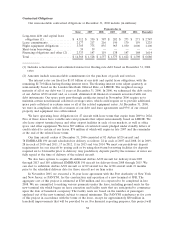
Year 2006 Compared to Year 2005
We had a net loss of $1 million in 2006 compared to a net loss of $20 million in 2005. In 2006, we
had operating income of $127 million, an increase of $79 million over 2005, and our operating margin
was 5.4%, up 2.6 points from 2005. Diluted loss per share was $0.00 for 2006 and $0.13 for 2005.
30