JetBlue Airlines 2006 Annual Report Download - page 39
Download and view the complete annual report
Please find page 39 of the 2006 JetBlue Airlines annual report below. You can navigate through the pages in the report by either clicking on the pages listed below, or by using the keyword search tool below to find specific information within the annual report.-
 1
1 -
2
-
3
-
4
-
5
-
6
-
7
-
8
-
9
-
10
-
11
-
12
-
13
-
14
-
15
-
16
-
17
-
18
-
19
-
20
-
21
-
22
-
23
-
24
-
25
-
26
-
27
-
28
-
 29
29 -
 30
30 -
 31
31 -
 32
32 -
 33
33 -
 34
34 -
 35
35 -
 36
36 -
 37
37 -
 38
38 -
 39
39 -
 40
40 -
 41
41 -
 42
42 -
 43
43 -
 44
44 -
 45
45 -
 46
46 -
 47
47 -
 48
48 -
 49
49 -
50
-
51
-
52
-
53
-
54
-
55
-
56
-
57
-
58
-
59
-
60
-
61
-
62
-
63
-
64
-
65
-
66
-
67
-
68
-
69
-
70
-
71
-
72
-
73
-
74
-
75
-
76
-
77
-
78
-
79
-
80
-
81
-
82
-
83
-
84
-
85
-
86
-
87
-
88
-
89
-
90
-
91
-
92
-
93
-
94
-
95
-
96
-
97
-
98
-
99
-
100
-
101
-
102
-
103
-
104
 |
 |
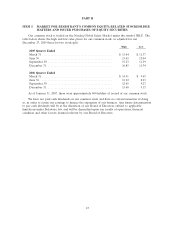
We strive to increase passenger revenue primarily by increasing our yield per flight, which
produces higher revenue per available seat mile, or RASM. Our objective is to optimize our fare mix
to increase our overall average fare and, in certain markets, utilize our network to maximize
connecting opportunities while continuing to provide our customers with low fares. During 2006, we
modified our fare mix to achieve higher yields while relinquishing some of our load factor. When we
enter a new market, our low fares are designed to stimulate demand, particularly from fare-conscious
leisure and business travelers who might otherwise have used alternate forms of transportation or
would not have traveled at all. In addition to our regular fare structure, we frequently offer sale fares
with shorter advance purchase requirements in most of the markets we serve and match the sale fares
offered by other airlines.
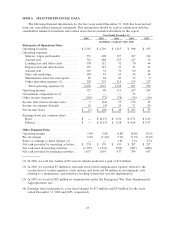
Other revenue consists primarily of the fees charged to customers in accordance with our
published policies relating to reservation changes and baggage limitations, the marketing component
of TrueBlue point sales and revenues earned by our subsidiary, LiveTV, LLC, for the sale of, and
on-going services provided for, in-flight entertainment systems sold to other airlines.
We have low operating expenses because we have high aircraft utilization, low distribution costs,
a productive workforce and operate a new fleet with only two types of aircraft. The largest
components of our operating expenses are aircraft fuel and salaries, wages and benefits provided to
our employees, including provisions for our profit sharing plan. Unlike most airlines, we have a
non-union workforce, which we believe provides us with more flexibility and allows us to be more
productive, although we are subject to ongoing attempts at unionization. The price and availability of
aircraft fuel, which is our single largest operating expense, are extremely volatile due to global
economic and geopolitical factors that we can neither control nor accurately predict. Sales and
marketing expenses include advertising and fees paid to credit card companies. Our distribution costs
tend to be lower than those of most other airlines on a per unit basis because the majority of our
customers book directly through our website or our agents. Maintenance materials and repairs are
expensed when incurred unless covered by a third party services contract. Because the average age of
our aircraft is 2.6 years, all of our aircraft require less maintenance now than they will in the future.
Our maintenance costs will increase significantly, both on an absolute basis and as a percentage of our
unit costs, as our fleet ages. Other operating expenses consist of purchased services (including
expenses related to fueling, ground handling, skycap, security and janitorial services), insurance,
personnel expenses, cost of goods sold to other airlines by LiveTV, professional fees, passenger
refreshments, supplies, bad debts, communication costs and taxes other than payroll taxes, including
fuel taxes.
The airline industry is one of the most heavily taxed in the U.S., with taxes and fees accounting
for approximately 14%of the total fare charged to a customer. Airlines are obligated to fund all of
these taxes and fees regardless of their ability to pass these charges on to the customer. Additionally,
if the TSA changes the way the Aviation Security Infrastructure Fee is assessed, our security costs
may be higher.
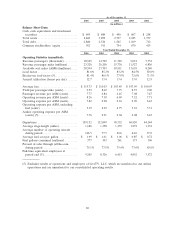
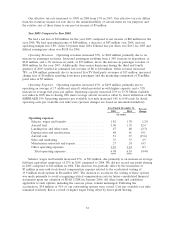
Our operating margin, which measures operating income as a percentage of operating revenues,
was 5.4%in 2006 and 2.8%in 2005 and was the third and second highest operating margin,
respectively, among all traditional network and low-cost major U.S. airlines.
The airline industry has been intensely competitive in recent years, due in part to persistently
high fuel prices and the adverse financial condition of many of the domestic airlines. In late 2005, US
Airways and America West merged and Delta Air Lines and Northwest Airlines filed for bankruptcy
protection. The airlines currently operating in bankruptcy may emerge with substantially lower costs
or consolidate with other carriers, either of which could allow them to compete more vigorously. In
the fourth quarter of 2006, there were other reports of potential consolidation. We are unable to
predict what the effect of further industry consolidation would be for us or for the airline industry in
general. During 2006, most traditional network airlines increased capacity on their international routes
and decreased domestic capacity. During the same period, some of our competitors, notably Delta Air
Lines and its discontinued low-fare operation, Song, shifted some of their domestic capacity out of
markets where they had competed directly with us. These developments, in conjunction with our shift
29