JetBlue Airlines 2006 Annual Report Download - page 43
Download and view the complete annual report
Please find page 43 of the 2006 JetBlue Airlines annual report below. You can navigate through the pages in the report by either clicking on the pages listed below, or by using the keyword search tool below to find specific information within the annual report.-
 1
1 -
2
-
3
-
4
-
5
-
6
-
7
-
8
-
9
-
10
-
11
-
12
-
13
-
14
-
15
-
16
-
17
-
18
-
19
-
20
-
21
-
22
-
23
-
24
-
25
-
26
-
27
-
28
-
29
-
30
-
31
-
32
-
 33
33 -
 34
34 -
 35
35 -
 36
36 -
 37
37 -
 38
38 -
 39
39 -
 40
40 -
 41
41 -
 42
42 -
 43
43 -
 44
44 -
 45
45 -
 46
46 -
 47
47 -
 48
48 -
 49
49 -
 50
50 -
 51
51 -
 52
52 -
 53
53 -
54
-
55
-
56
-
57
-
58
-
59
-
60
-
61
-
62
-
63
-
64
-
65
-
66
-
67
-
68
-
69
-
70
-
71
-
72
-
73
-
74
-
75
-
76
-
77
-
78
-
79
-
80
-
81
-
82
-
83
-
84
-
85
-
86
-
87
-
88
-
89
-
90
-
91
-
92
-
93
-
94
-
95
-
96
-
97
-
98
-
99
-
100
-
101
-
102
-
103
-
104
 |
 |

Our effective tax rate increased to 109%in 2006 from 15%in 2005. Our effective tax rate differs
from the statutory income tax rate due to the nondeductibility of certain items for tax purposes and
the relative size of these items to our pre-tax income of $9 million.
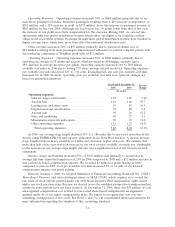
Year 2005 Compared to Year 2004
We had a net loss of $20 million for the year 2005 compared to net income of $46 million for the
year 2004. We had operating income of $48 million, a decrease of $63 million over 2004, and our
operating margin was 2.8%, down 6.0 points from 2004. Diluted loss per share was $0.13 for 2005 and
diluted earnings per share was $0.28 for 2004.
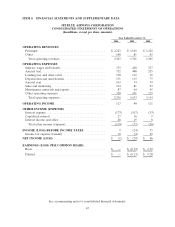
Operating Revenues. Operating revenues increased 35%, or $436 million, primarily due to an
increase in passenger revenues. Increased passengers resulting from a 24%increase in departures, or
$345 million, and a 3%increase in yields, or $55 million, drove the increase in passenger revenue of
$400 million for the year 2005. Additionally, three major hurricanes during the third and fourth
quarters of 2005 resulted in estimated lost revenue of $8 to $10 million. Other revenue increased
78%, or $36 million, primarily due to increased LiveTV third party revenues of $13 million, increased
change fees of $6 million resulting from more passengers and the marketing component of TrueBlue
point sales of $7 million.
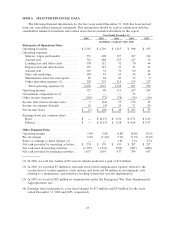
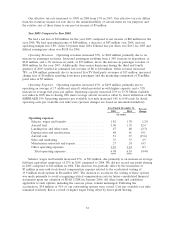
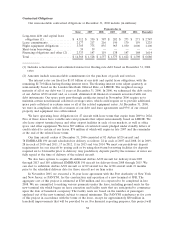
Operating Expenses. Operating expenses increased 43%, or $499 million, primarily due to
operating an average of 17 additional aircraft, which provided us with higher capacity, and a 52%
increase in average fuel price per gallon. Operating capacity increased 25%to 23.70 billion available
seat miles in 2005 due to having 28%more average aircraft in-service offset by lower utilization of the
EMBRAER 190. Operating expenses per available seat mile increased 14%to 6.98 cents. In detail,
operating costs per available seat mile were (percent changes are based on unrounded numbers):
Year Ended December 31, Percent
Change2005 2004
(in cents)
Operating expenses:
Salaries, wages and benefits .......................... 1.81 1.78 1.2%
Aircraft fuel ........................................ 2.06 1.35 52.4
Landing fees and other rents ......................... .47 .48 (2.3)
Depreciation and amortization........................ .48 .41 19.1
Aircraft rent........................................ .31 .37 (15.6)
Sales and marketing ................................. .35 .33 2.9
Maintenance materials and repairs .................... .27 .24 14.5
Other operating expenses ............................ 1.23 1.14 8.3
Total operating expenses ........................... 6.98 6.10 14.4%
Salaries, wages and benefits increased 27%, or $91 million, due primarily to an increase in average
full-time equivalent employees of 27%in 2005 compared to 2004. We did not record any profit sharing
in 2005 compared to $14 million in 2004. This decrease was partially offset by the incurrence of
$7 million in non-cash stock-based compensation expense related to the accelerated vesting of
19.9 million stock options in December 2005. The decision to accelerate the vesting of these options
was made primarily to avoid recognizing related compensation costs in future consolidated financial
statements upon our adoption of SFAS 123(R) in January 2006. All other terms and conditions
applicable to such options, including the exercise prices, remain unchanged. Following the
acceleration, 28.4 million or 91%of our outstanding options were vested. Cost per available seat mile
remained relatively flat as a result of higher wages being offset by lower profit sharing.
33