JetBlue Airlines 2006 Annual Report Download - page 41
Download and view the complete annual report
Please find page 41 of the 2006 JetBlue Airlines annual report below. You can navigate through the pages in the report by either clicking on the pages listed below, or by using the keyword search tool below to find specific information within the annual report.-
 1
1 -
2
-
3
-
4
-
5
-
6
-
7
-
8
-
9
-
10
-
11
-
12
-
13
-
14
-
15
-
16
-
17
-
18
-
19
-
20
-
21
-
22
-
23
-
24
-
25
-
26
-
27
-
28
-
29
-
30
-
 31
31 -
 32
32 -
 33
33 -
 34
34 -
 35
35 -
 36
36 -
 37
37 -
 38
38 -
 39
39 -
 40
40 -
 41
41 -
 42
42 -
 43
43 -
 44
44 -
 45
45 -
 46
46 -
 47
47 -
 48
48 -
 49
49 -
 50
50 -
 51
51 -
52
-
53
-
54
-
55
-
56
-
57
-
58
-
59
-
60
-
61
-
62
-
63
-
64
-
65
-
66
-
67
-
68
-
69
-
70
-
71
-
72
-
73
-
74
-
75
-
76
-
77
-
78
-
79
-
80
-
81
-
82
-
83
-
84
-
85
-
86
-
87
-
88
-
89
-
90
-
91
-
92
-
93
-
94
-
95
-
96
-
97
-
98
-
99
-
100
-
101
-
102
-
103
-
104
 |
 |

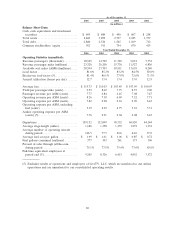
Operating Revenues. Operating revenues increased 39%, or $662 million, primarily due to an
increase in passenger revenues. Increased passengers resulting from a 42%increase in departures, or
$251 million, and a 19%increase in yield, or $352 million, drove the increase in passenger revenue of
$603 million for the year 2006. Although our load factor was 3.6 points lower than that of last year,
the increase in our yields more than compensated for this decrease. During 2006, we entered into
agreements with four global distribution systems, which allow our flights to be available on their
online travel reservation systems. Bookings through these global distribution systems have resulted in
higher average fares, which have more than offset the increased distribution costs.
Other revenue increased 74%, or $59 million, primarily due to increased change fees of
$22 million resulting from more passengers and increased adherence to related company polices and
the marketing component of TrueBlue point sales of $11 million.
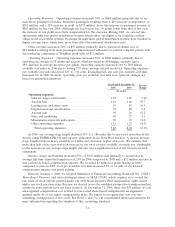
Operating Expenses. Operating expenses increased 35%, or $583 million, primarily due to
operating an average of 29 additional aircraft, which provided us with higher capacity, and a
24%increase in average fuel price per gallon. Operating capacity increased 21%to 28.6 billion
available seat miles in 2006 due to having 37%more average aircraft in-service. Operating expenses
per available seat mile increased 12%to 7.82 cents. Excluding fuel, our cost per available seat mile
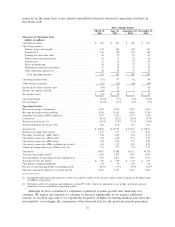
increased 6%in 2006. In detail, operating costs per available seat mile were (percent changes are
based on unrounded numbers):
Year Ended December 31, Percent
Change2006 2005
(in cents)
Operating expenses:
Salaries, wages and benefits .......................... 1.94 1.81 7.2%
Aircraft fuel ........................................ 2.63 2.06 27.7
Landing fees and other rents ......................... .55 .47 16.5
Depreciation and amortization........................ .53 .48 9.2
Aircraft rent........................................ .36 .31 15.2
Sales and marketing ................................. .36 .35 5.3
Maintenance materials and repairs .................... .30 .27 12.6
Other operating expenses ............................ 1.15 1.23 (6.5)
Total operating expenses ........................... 7.82 6.98 12.1%
In 2006, our average stage length declined 13%to 1,186 miles due to increased operation of the
shorter range EMBRAER 190 and capacity reductions in our East-West markets. A shorter average
stage length results in fewer available seat miles and, therefore, higher unit costs. We estimate that
more than half of the year-over-year increase in our total cost per available seat mile was attributable
to the decrease in our average stage length and also was a significant factor of the increase in each
component.
Salaries, wages and benefits increased 29%, or $125 million, due primarily to an increase in
average full-time equivalent employees of 25%in 2006 compared to 2005 and a $12 million increase in
non-cash stock-based compensation expense. We recorded $3 million of profit sharing in 2006
compared to none in 2005. Cost per available seat mile increased 7%as a result of stock-based
compensation expense and profit sharing.
Effective January 1, 2006, we adopted Statement of Financial Accounting Standards No. 123(R),
Share-Based Payment, and related interpretations, or SFAS 123(R), which requires us to record the
fair value of stock options granted under our 2002 Stock Incentive Plan and purchase rights issued
under our stock purchase plan. Because we elected to use the modified prospective transition method,
results for prior periods have not been restated. At December 31, 2006, there was $35 million of total
unrecognized compensation cost related to non-vested share-based compensation arrangements
granted under all of our equity compensation plans. We expect to recognize that cost over the
remaining vesting period of five years. See Notes 1 and 7 to our consolidated financial statements for
more information regarding the adoption of this accounting standard.
31