JetBlue Airlines 2006 Annual Report Download - page 44
Download and view the complete annual report
Please find page 44 of the 2006 JetBlue Airlines annual report below. You can navigate through the pages in the report by either clicking on the pages listed below, or by using the keyword search tool below to find specific information within the annual report.-
 1
1 -
2
-
3
-
4
-
5
-
6
-
7
-
8
-
9
-
10
-
11
-
12
-
13
-
14
-
15
-
16
-
17
-
18
-
19
-
20
-
21
-
22
-
23
-
24
-
25
-
26
-
27
-
28
-
29
-
30
-
31
-
32
-
33
-
 34
34 -
 35
35 -
 36
36 -
 37
37 -
 38
38 -
 39
39 -
 40
40 -
 41
41 -
 42
42 -
 43
43 -
 44
44 -
 45
45 -
 46
46 -
 47
47 -
 48
48 -
 49
49 -
 50
50 -
 51
51 -
 52
52 -
 53
53 -
 54
54 -
55
-
56
-
57
-
58
-
59
-
60
-
61
-
62
-
63
-
64
-
65
-
66
-
67
-
68
-
69
-
70
-
71
-
72
-
73
-
74
-
75
-
76
-
77
-
78
-
79
-
80
-
81
-
82
-
83
-
84
-
85
-
86
-
87
-
88
-
89
-
90
-
91
-
92
-
93
-
94
-
95
-
96
-
97
-
98
-
99
-
100
-
101
-
102
-
103
-
104
 |
 |
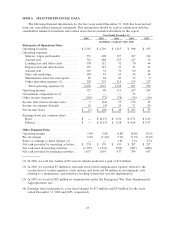
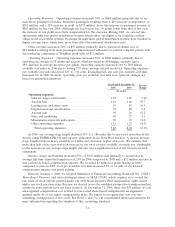
Aircraft fuel expense increased 91%, or $233 million, due to 62 million more gallons of aircraft
fuel consumed resulting in $66 million of additional fuel expense and, even after giving effect to
$43 million of fuel hedging gains, a 52%increase in average fuel cost per gallon, or $167 million. Our
fuel costs represented 30%and 22%of our operating expenses in 2005 and 2004, respectively. During
2005, aircraft fuel prices remained at historically high levels, with our average fuel price per gallon at
$1.61 compared to $1.06 in 2004. Cost per available seat mile increased 52%due to the increase in
average fuel cost per gallon.
Landing fees and other rents increased 22%, or $20 million, due to a 23.7%increase in departures
over 2004 offset by lower landing fee rates. Cost per available seat mile decreased 2.3%due to higher
capacity and an increase in average stage length. Landing fees and other rents are expected to
increase in 2006 as a result of ground rent on our new terminal at JFK, which is under construction.
Depreciation and amortization increased 49%, or $38 million, primarily due to having an average
of 52 owned aircraft in 2005 compared to 36 in 2004. Cost per available seat mile increased 19%due
to a higher percentage of our aircraft fleet being owned and as a result of placing into service our new
hangars and training center during 2005.
Aircraft rent increased 6%, or $4 million, due to $2 million in higher rental rates and $2 million
related to new aircraft leases. Cost per available seat mile decreased 16%due to higher capacity and a
lower percentage of our fleet being leased.
Sales and marketing expense increased 29%, or $18 million, due to higher credit card fees
resulting from increased passenger revenues. On a cost per available seat mile basis, sales and
marketing expense increased 3%primarily due to higher credit card fees resulting from higher average
fares. We book all of our reservations through a combination of our website and our agents (78%and
22%in 2005, respectively).
Maintenance materials and repairs increased 44%, or $19 million, due to 17 more average aircraft
in 2005 compared to 2004 and a gradual aging of our fleet. Cost per available seat mile increased 15%
year-over-year due to the completion of 63 airframe checks in 2005 compared to 54 in 2004, as well as
increased engine and component repairs.
Effective July 1, 2005, we executed a ten-year engine services agreement with MTU covering the
scheduled and unscheduled repair of the engines on our Airbus A320 aircraft. This agreement
requires monthly payments to MTU at rates based on number of flight hours each engine was
operated during each month. MTU has assumed the responsibility to repair and overhaul our engines
as required during the term of the agreement. These payments will be expensed as the flight hours are
incurred. This agreement will eliminate the significant judgment in determining estimated costs of
overhauls and is expected to result in lower maintenance costs than on a time and materials basis.
Other operating expenses increased 36%, or $76 million, primarily due to higher variable costs
associated with increased capacity and number of passengers served. Cost per available seat mile
increased 8%as a result of increased LiveTV third party installations, fuel related taxes and services,
and a $6 million write-off of development costs related to a maintenance and inventory tracking
system.
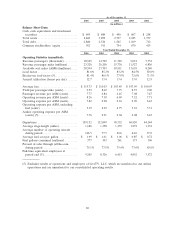
Other Income (Expense). Interest expense increased 99%primarily due to our debt financing of
16 additional aircraft and interest on our $250 million convertible debt issued in March 2005, resulting
in $35 million of additional interest expense and higher interest rates, which resulted in $19 million of
additional interest expense. Interest income increased by $11 million due to higher interest rates.
Capitalized interest increased 79%, or $7 million, due to higher predelivery deposit balances and
increased rates.
Our effective tax rate decreased to 15%in 2005 from 38%in 2004. The decrease is attributable to
our decreased profitability resulting primarily from higher fuel prices and the non-deductibility of
certain items for tax purposes.
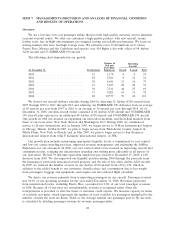
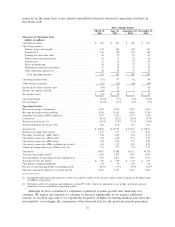
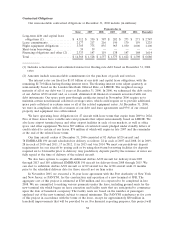
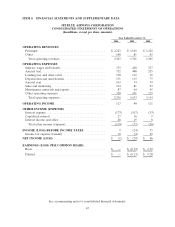
Quarterly Results of Operations
The following table sets forth selected financial data and operating statistics for the four quarters
ended December 31, 2006. The information for each of these quarters is unaudited and has been
34