Intel 2009 Annual Report Download - page 92
Download and view the complete annual report
Please find page 92 of the 2009 Intel annual report below. You can navigate through the pages in the report by either clicking on the pages listed below, or by using the keyword search tool below to find specific information within the annual report.-
 1
1 -
2
-
3
-
4
-
5
-
6
-
7
-
8
-
9
-
10
-
11
-
12
-
13
-
14
-
15
-
16
-
17
-
18
-
19
-
20
-
21
-
22
-
23
-
24
-
25
-
26
-
27
-
28
-
29
-
30
-
31
-
32
-
33
-
34
-
35
-
36
-
37
-
38
-
39
-
40
-
41
-
42
-
43
-
44
-
45
-
46
-
47
-
48
-
49
-
50
-
51
-
52
-
53
-
54
-
55
-
56
-
57
-
58
-
59
-
60
-
61
-
62
-
63
-
64
-
65
-
66
-
67
-
68
-
69
-
70
-
71
-
72
-
73
-
74
-
75
-
76
-
77
-
78
-
79
-
80
-
81
-
 82
82 -
 83
83 -
 84
84 -
 85
85 -
 86
86 -
 87
87 -
 88
88 -
 89
89 -
 90
90 -
 91
91 -
 92
92 -
 93
93 -
 94
94 -
 95
95 -
 96
96 -
 97
97 -
 98
98 -
 99
99 -
 100
100 -
 101
101 -
 102
102 -
103
-
104
-
105
-
106
-
107
-
108
-
109
-
110
-
111
-
112
-
113
-
114
-
115
-
116
-
117
-
118
-
119
-
120
-
121
-
122
-
123
-
124
-
125
-
126
-
127
-
128
-
129
-
130
-
131
-
132
-
133
-
134
-
135
-
136
-
137
-
138
-
139
-
140
-
141
-
142
-
143
-
144
-
145
-
146
-
147
-
148
-
149
-
150
-
151
-
152
-
153
-
154
-
155
-
156
-
157
-
158
-
159
-
160
-
161
-
162
-
163
-
164
-
165
-
166
-
167
-
168
-
169
-
170
-
171
-
172
 |
 |

Table of Contents
INTEL CORPORATION
NOTES TO CONSOLIDATED FINANCIAL STATEMENTS (Continued)
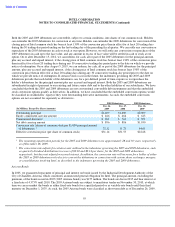
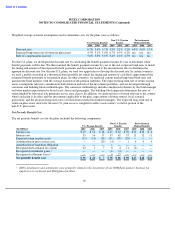
After completing our annual impairment reviews during the fourth quarter of 2009, 2008, and 2007, we concluded that
goodwill was not impaired in any year. As of December 26, 2009, accumulated impairment losses in total were $713 million:
$355 million associated with our PC Client Group, $279 million associated with our Data Center Group, and $79 million
associated with other Intel architecture operating segments.
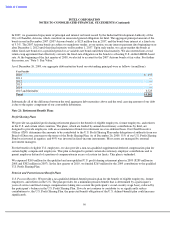
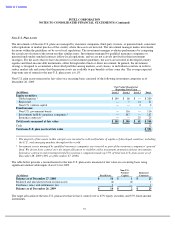
Note 18: Identified Intangible Assets
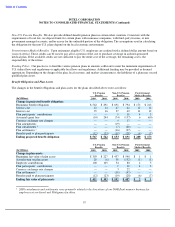
We classify identified intangible assets within other long-term assets on the consolidated balance sheets. Identified intangible
assets consisted of the following as of December 26, 2009:
During 2009, we acquired intellectual property assets for $99 million with a weighted average life of six years. During 2009,
as a result of our acquisition of Wind River Systems, we recorded acquisition-related developed technology for $148 million
with a weighted average life of four years, and additions to other intangible assets of $169 million with a weighted average life
of seven years. The substantial majority of other intangible assets recorded were associated with customer relationships and
the Wind River Systems trade name. The remaining amount of other intangible assets was related to acquired in-process
research and development.
Identified intangible assets consisted of the following as of December 27, 2008:
During 2008, we acquired intellectual property assets for $68 million with a weighted average life of 10 years.
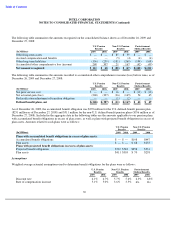
We recorded the amortization of identified intangible assets on the consolidated statements of operations as cost of sales,
amortization of acquisition-related intangibles, or a reduction of revenue.
Amortization expenses for the three years ended December 26, 2009 were as follows:
Based on identified intangible assets recorded as of December 26, 2009, and assuming that the underlying assets will not be
impaired in the future, we expect amortization expenses for each period to be as follows:
81
Accumulated
(In Millions)
Gross Assets
Amortization
Net
Intellectual property assets
$
1,190
$
(616
)
$
574
Acquisition
-
related developed technology
166
(34
)
132
Other intangible assets
509
(332
)
177
Total identified intangible assets
$
1,865
$
(982
)
$
883
Accumulated
(In Millions)
Gross Assets
Amortization
Net
Intellectual property assets
$
1,206
$
(582
)
$
624
Acquisition
-
related developed technology
22
(8
)
14
Other intangible assets
340
(203
)
137
Total identified intangible assets
$
1,568
$
(793
)
$
775
(In Millions)
2009
2008
2007
Intellectual property assets
$
149
$
164
$
159
Acquisition
-
related developed technology
$
30
$
5
$
1
Other intangible assets
$
129
$
87
$
92
(In Millions)
2010
2011
2012
2013
2014
Intellectual property assets
$
147
$
95
$
84
$
67
$
56
Acquisition
-
related developed technology
$
54
$
45
$
24
$
9
$
—
Other intangible assets
$
26
$
21
$
24
$
23
$
20