Intel 2009 Annual Report Download - page 89
Download and view the complete annual report
Please find page 89 of the 2009 Intel annual report below. You can navigate through the pages in the report by either clicking on the pages listed below, or by using the keyword search tool below to find specific information within the annual report.-
 1
1 -
2
-
3
-
4
-
5
-
6
-
7
-
8
-
9
-
10
-
11
-
12
-
13
-
14
-
15
-
16
-
17
-
18
-
19
-
20
-
21
-
22
-
23
-
24
-
25
-
26
-
27
-
28
-
29
-
30
-
31
-
32
-
33
-
34
-
35
-
36
-
37
-
38
-
39
-
40
-
41
-
42
-
43
-
44
-
45
-
46
-
47
-
48
-
49
-
50
-
51
-
52
-
53
-
54
-
55
-
56
-
57
-
58
-
59
-
60
-
61
-
62
-
63
-
64
-
65
-
66
-
67
-
68
-
69
-
70
-
71
-
72
-
73
-
74
-
75
-
76
-
77
-
78
-
 79
79 -
 80
80 -
 81
81 -
 82
82 -
 83
83 -
 84
84 -
 85
85 -
 86
86 -
 87
87 -
 88
88 -
 89
89 -
 90
90 -
 91
91 -
 92
92 -
 93
93 -
 94
94 -
 95
95 -
 96
96 -
 97
97 -
 98
98 -
 99
99 -
100
-
101
-
102
-
103
-
104
-
105
-
106
-
107
-
108
-
109
-
110
-
111
-
112
-
113
-
114
-
115
-
116
-
117
-
118
-
119
-
120
-
121
-
122
-
123
-
124
-
125
-
126
-
127
-
128
-
129
-
130
-
131
-
132
-
133
-
134
-
135
-
136
-
137
-
138
-
139
-
140
-
141
-
142
-
143
-
144
-
145
-
146
-
147
-
148
-
149
-
150
-
151
-
152
-
153
-
154
-
155
-
156
-
157
-
158
-
159
-
160
-
161
-
162
-
163
-
164
-
165
-
166
-
167
-
168
-
169
-
170
-
171
-
172
 |
 |

Table of Contents
INTEL CORPORATION
NOTES TO CONSOLIDATED FINANCIAL STATEMENTS (Continued)
Subsequent to the end of 2009, in February 2010, we signed a definitive agreement with Micron and Numonyx under which
Micron agreed to acquire Numonyx in an all-stock transaction. Under the terms of the agreement, Intel, STMicroelectronics,
and Francisco Partners would sell their financial interest in Numonyx for 140 million shares of Micron common stock plus,
under certain circumstances, up to an additional 10 million shares of Micron common stock.
Clearwire LLC
In 2008, we invested $1.0 billion in Clearwire LLC, a wholly owned subsidiary of Clearwire Corporation. In the fourth quarter
of 2009, we invested an additional $50 million. Our investment in Clearwire LLC is accounted for under the equity method of
accounting, and our proportionate share of the income or loss is recognized on a one-quarter lag. During 2009, we recorded
$27 million of equity method losses, which was net of a gain of $37 million as a result of a dilution of our ownership interest
from the additional investment. Due to the one-quarter lag, we did not record equity method adjustments related to Clearwire
LLC during 2008. During 2008, we recorded a $762 million impairment charge on our investment in Clearwire LLC to write
down our investment to its fair value. The impairment charge was included in gains (losses) on equity method investments,
net. For further discussion, see “Note 5: Fair Value.”
As of December 26, 2009, our investment balance in Clearwire LLC was $261 million and is classified within other long-term
assets ($238 million as of December 27, 2008). As of December 26, 2009, the carrying value of our investment in Clearwire
LLC was $323 million below our share of the book value of the net assets of Clearwire Corporation, and a substantial majority
of this difference has been assigned to Clearwire Corporation spectrum assets, a majority of which have an indefinite life.
Cost Method Investments
The carrying value of our non-marketable cost method investments was $939 million as of December 26, 2009 and $1.0
billion as of December 27, 2008. In 2009, we recognized impairment charges on non-marketable cost method investments of
$179 million within gains (losses) on other equity investments ($135 million in 2008 and $90 million in 2007).
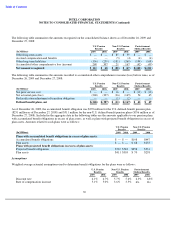
Note 12: Gains (Losses) on Equity Method Investments, Net
Gains (losses) on equity method investments, net included:
Note 13: Gains (Losses) on Other Equity Investments, Net
Gains (losses) on other equity investments, net included:
78
(In Millions)
2009
2008
2007
Equity method losses, net
$
(131
)
$
(316
)
$
(103
)
Impairment charges
(42
)
(1,077
)
(28
)
Other, net
26
13
134
Total gains (losses) on equity method investments, net
$
(147
)
$
(1,380
)
$
3
(In Millions)
2009
2008
2007
Impairment charges
$
(179
)
$
(455
)
$
(92
)
Gains on sales, net
55
60
204
Other, net
101
19
42
Total gains (losses) on other equity investments, net
$
(23
)
$
(376
)
$
154