Intel 2009 Annual Report Download - page 45
Download and view the complete annual report
Please find page 45 of the 2009 Intel annual report below. You can navigate through the pages in the report by either clicking on the pages listed below, or by using the keyword search tool below to find specific information within the annual report.-
 1
1 -
2
-
3
-
4
-
5
-
6
-
7
-
8
-
9
-
10
-
11
-
12
-
13
-
14
-
15
-
16
-
17
-
18
-
19
-
20
-
21
-
22
-
23
-
24
-
25
-
26
-
27
-
28
-
29
-
30
-
31
-
32
-
33
-
34
-
 35
35 -
 36
36 -
 37
37 -
 38
38 -
 39
39 -
 40
40 -
 41
41 -
 42
42 -
 43
43 -
 44
44 -
 45
45 -
 46
46 -
 47
47 -
 48
48 -
 49
49 -
 50
50 -
 51
51 -
 52
52 -
 53
53 -
 54
54 -
 55
55 -
56
-
57
-
58
-
59
-
60
-
61
-
62
-
63
-
64
-
65
-
66
-
67
-
68
-
69
-
70
-
71
-
72
-
73
-
74
-
75
-
76
-
77
-
78
-
79
-
80
-
81
-
82
-
83
-
84
-
85
-
86
-
87
-
88
-
89
-
90
-
91
-
92
-
93
-
94
-
95
-
96
-
97
-
98
-
99
-
100
-
101
-
102
-
103
-
104
-
105
-
106
-
107
-
108
-
109
-
110
-
111
-
112
-
113
-
114
-
115
-
116
-
117
-
118
-
119
-
120
-
121
-
122
-
123
-
124
-
125
-
126
-
127
-
128
-
129
-
130
-
131
-
132
-
133
-
134
-
135
-
136
-
137
-
138
-
139
-
140
-
141
-
142
-
143
-
144
-
145
-
146
-
147
-
148
-
149
-
150
-
151
-
152
-
153
-
154
-
155
-
156
-
157
-
158
-
159
-
160
-
161
-
162
-
163
-
164
-
165
-
166
-
167
-
168
-
169
-
170
-
171
-
172
 |
 |

Table of Contents
MANAGEMENT’S DISCUSSION AND ANALYSIS OF FINANCIAL CONDITION AND RESULTS OF
OPERATIONS (Continued)
Interest and other, net decreased in 2008 compared to 2007 due to lower interest income and fair value losses that we
experienced in 2008 on our trading assets. Interest income was lower in 2008 compared to 2007 as a result of lower interest
rates, partially offset by higher average investment balances. The average interest rate earned during 2008 decreased by 1.9
percentage points compared to 2007.
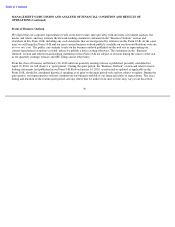
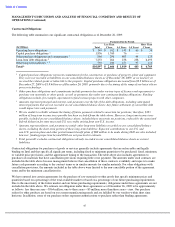
Provision for Taxes
Our provision for taxes and effective tax rate were as follows:
We generated a higher percentage of our profits from lower tax jurisdictions in 2009 compared to 2008. In addition, the 2009
tax rate was positively impacted by the reversal of previously accrued taxes of $366 million on settlements, effective
settlements, and related remeasurements of various uncertain tax positions compared to a reversal of $103 million for such
matters in 2008. These impacts were partially offset by the recognition of the EC fine of $1.447 billion with no associated tax
benefit. In addition, our 2008 effective tax rate was negatively impacted by the recognition of a valuation allowance on our
deferred tax assets due to the uncertainty of realizing tax benefits related to impairments of our equity investments.
Our effective income tax rate increased in 2008 compared to 2007, primarily due to the recognition of a valuation allowance
on our deferred tax assets due to the uncertainty of realizing tax benefits related to impairments of our equity investments. In
addition, the rate increased in 2008 compared to 2007, due to the reversal of previously accrued taxes of $481 million
(including $50 million of accrued interest) related to settlements with the U.S. Internal Revenue Service (IRS) in the first and
second quarters of 2007.
Business Outlook
Our future results of operations and the topics of other forward-looking statements contained in this Form 10-K, including this
MD&A, involve a number of risks and uncertainties—in particular:
In addition to the various important factors discussed above, a number of other important factors could cause actual results to
differ materially from our expectations. See the risks described in “Risk Factors” in Part I, Item 1A of this Form 10-K.
Our expectations for 2010 are as follows:
39
(Dollars in Millions)
2009
2008
2007
Income before taxes
$
5,704
$
7,686
$
9,166
Provision for taxes
$
1,335
$
2,394
$
2,190
Effective tax rate
23.4
%
31.1
%
23.9
%
• Gross Margin Percentage. 61%, plus or minus three points. The 61% midpoint is higher than our 2009 gross margin
of 55.7%, primarily due to lower manufacturing period costs, mostly factory underutilization charges. In addition, we
expect lower unit costs and higher unit sales, partially offset by lower average selling prices.
• Total Spending. We expect spending on R&D, plus marketing, general and administrative expenses, in 2010 to be
approximately $11.8 billion, plus or minus $100 million, compared to $13.6 billion in 2009. Total spending in 2009
included charges of $1.447 billion incurred as a result of the fine imposed by the EC and $1.25 billion as a result of our
legal settlement with AMD.
•
Research and Development Spending.
Approximately $6.2 billion compared to $5.7 billion in 2009.
•
Capital Spending.
Approximately $4.8 billion, plus or minus $100 million, compared to $4.5 billion in 2009.
•
Depreciation.
Approximately $4.4 billion, plus or minus $100 million, compared to $4.7 billion in 2009.
• Tax Rate. Approximately 30%, compared to 23% in 2009. The estimated effective tax rate is based on tax law in
effect as of December 26, 2009 and expected income.
•
changes in business and economic conditions;
•
revenue and pricing;
•
gross margin and costs;
•
pending legal proceedings;
•
our effective tax rate (including changes in unrecognized
tax positions);
•
marketing, general and administrative expenses;
•
our goals and strategies;
•
new product introductions;
•
plans to cultivate new businesses;
•
R&D expenses;
•
divestitures or investments;
•
net gains (losses) from equity investments;
•
interest and other, net;
•
capital spending;
•
depreciation; and
•
impairment of investments.