Intel 2009 Annual Report Download - page 103
Download and view the complete annual report
Please find page 103 of the 2009 Intel annual report below. You can navigate through the pages in the report by either clicking on the pages listed below, or by using the keyword search tool below to find specific information within the annual report.-
 1
1 -
2
-
3
-
4
-
5
-
6
-
7
-
8
-
9
-
10
-
11
-
12
-
13
-
14
-
15
-
16
-
17
-
18
-
19
-
20
-
21
-
22
-
23
-
24
-
25
-
26
-
27
-
28
-
29
-
30
-
31
-
32
-
33
-
34
-
35
-
36
-
37
-
38
-
39
-
40
-
41
-
42
-
43
-
44
-
45
-
46
-
47
-
48
-
49
-
50
-
51
-
52
-
53
-
54
-
55
-
56
-
57
-
58
-
59
-
60
-
61
-
62
-
63
-
64
-
65
-
66
-
67
-
68
-
69
-
70
-
71
-
72
-
73
-
74
-
75
-
76
-
77
-
78
-
79
-
80
-
81
-
82
-
83
-
84
-
85
-
86
-
87
-
88
-
89
-
90
-
91
-
92
-
 93
93 -
 94
94 -
 95
95 -
 96
96 -
 97
97 -
 98
98 -
 99
99 -
 100
100 -
 101
101 -
 102
102 -
 103
103 -
 104
104 -
 105
105 -
 106
106 -
 107
107 -
 108
108 -
 109
109 -
 110
110 -
 111
111 -
 112
112 -
 113
113 -
114
-
115
-
116
-
117
-
118
-
119
-
120
-
121
-
122
-
123
-
124
-
125
-
126
-
127
-
128
-
129
-
130
-
131
-
132
-
133
-
134
-
135
-
136
-
137
-
138
-
139
-
140
-
141
-
142
-
143
-
144
-
145
-
146
-
147
-
148
-
149
-
150
-
151
-
152
-
153
-
154
-
155
-
156
-
157
-
158
-
159
-
160
-
161
-
162
-
163
-
164
-
165
-
166
-
167
-
168
-
169
-
170
-
171
-
172
 |
 |

Table of Contents
INTEL CORPORATION
NOTES TO CONSOLIDATED FINANCIAL STATEMENTS (Continued)
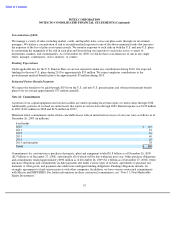
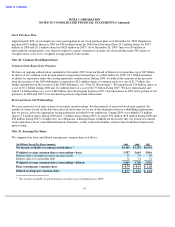
Concentration of Risk
We manage a variety of risks, including market, credit, and liquidity risks, across our plan assets through our investment
managers. We define a concentration of risk as an undiversified exposure to one of the above-mentioned risks that increases
the exposure of the loss of plan assets unnecessarily. We monitor exposure to such risks in both the U.S. and non-U.S. plans
by monitoring the magnitude of the risk in each plan and diversifying our exposure to such risks across a variety of
instruments, markets, and counterparties. As of December 26, 2009, we did not have concentrations of risk in any single
entity, manager, counterparty, sector, industry, or country.
Funding Expectations
Under applicable law for the U.S. Pension Plan, we are not required to make any contributions during 2010. Our expected
funding for the non-U.S. plans during 2010 is approximately $55 million. We expect employer contributions to the
postretirement medical benefits plan to be approximately $5 million during 2010.
Estimated Future Benefit Payments
We expect the benefits to be paid through 2019 from the U.S. and non-U.S. pension plans and other postretirement benefit
plans to be on average approximately $75 million annually.
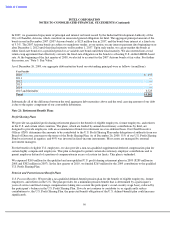
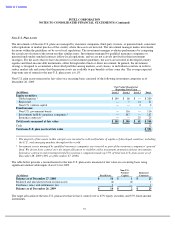
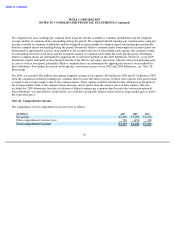
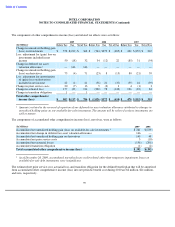
Note 22: Commitments
A portion of our capital equipment and certain facilities are under operating leases that expire at various dates through 2028.
Additionally, portions of our land are under leases that expire at various dates through 2062. Rental expense was $120 million
in 2009 ($141 million in 2008 and $154 million in 2007).
Minimum rental commitments under all non-cancelable leases with an initial term in excess of one year were as follows as of
December 26, 2009 (in millions):
Commitments for construction or purchase of property, plant and equipment totaled $1.8 billion as of December 26, 2009
($2.9 billion as of December 27, 2008), substantially all of which will be due within the next year. Other purchase obligations
and commitments totaled approximately $900 million as of December 26, 2009 ($1.2 billion as of December 27, 2008). Other
purchase obligations and commitments include payments due under various types of licenses, agreements to purchase raw
materials or other goods, and payments due under non-contingent funding obligations. Funding obligations include, for
example, agreements to fund various projects with other companies. In addition, we have various contractual commitments
with Micron and IMFT/IMFS. For further information on these contractual commitments, see “Note 11: Non-Marketable
Equity Investments.”
92
Year Payable
2010
$
102
2011
83
2012
66
2013
40
2014
20
2015 and thereafter
38
Total
$
349