Intel 2009 Annual Report Download - page 59
Download and view the complete annual report
Please find page 59 of the 2009 Intel annual report below. You can navigate through the pages in the report by either clicking on the pages listed below, or by using the keyword search tool below to find specific information within the annual report.-
 1
1 -
2
-
3
-
4
-
5
-
6
-
7
-
8
-
9
-
10
-
11
-
12
-
13
-
14
-
15
-
16
-
17
-
18
-
19
-
20
-
21
-
22
-
23
-
24
-
25
-
26
-
27
-
28
-
29
-
30
-
31
-
32
-
33
-
34
-
35
-
36
-
37
-
38
-
39
-
40
-
41
-
42
-
43
-
44
-
45
-
46
-
47
-
48
-
 49
49 -
 50
50 -
 51
51 -
 52
52 -
 53
53 -
 54
54 -
 55
55 -
 56
56 -
 57
57 -
 58
58 -
 59
59 -
 60
60 -
 61
61 -
 62
62 -
 63
63 -
 64
64 -
 65
65 -
 66
66 -
 67
67 -
 68
68 -
 69
69 -
70
-
71
-
72
-
73
-
74
-
75
-
76
-
77
-
78
-
79
-
80
-
81
-
82
-
83
-
84
-
85
-
86
-
87
-
88
-
89
-
90
-
91
-
92
-
93
-
94
-
95
-
96
-
97
-
98
-
99
-
100
-
101
-
102
-
103
-
104
-
105
-
106
-
107
-
108
-
109
-
110
-
111
-
112
-
113
-
114
-
115
-
116
-
117
-
118
-
119
-
120
-
121
-
122
-
123
-
124
-
125
-
126
-
127
-
128
-
129
-
130
-
131
-
132
-
133
-
134
-
135
-
136
-
137
-
138
-
139
-
140
-
141
-
142
-
143
-
144
-
145
-
146
-
147
-
148
-
149
-
150
-
151
-
152
-
153
-
154
-
155
-
156
-
157
-
158
-
159
-
160
-
161
-
162
-
163
-
164
-
165
-
166
-
167
-
168
-
169
-
170
-
171
-
172
 |
 |

Table of Contents
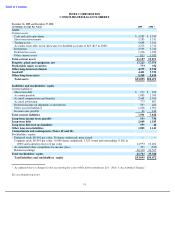
INTEL CORPORATION
CONSOLIDATED BALANCE SHEETS
See accompanying notes.
51
December 26, 2009 and December 27, 2008
(In Millions, Except Par Value)
2009
2008
1
Assets
Current assets:
Cash and cash equivalents
$
3,987
$
3,350
Short
-
term investments
5,285
5,331
Trading assets
4,648
3,162
Accounts receivable, net of allowance for doubtful accounts of $19 ($17 in 2008)
2,273
1,712
Inventories
2,935
3,744
Deferred tax assets
1,216
1,390
Other current assets
813
1,182
Total current assets
21,157
19,871
Property, plant and equipment, net
17,225
17,574
Marketable equity securities
773
352
Other long-term investments
4,179
2,924
Goodwill
4,421
3,932
Other long
-
term assets
5,340
5,819
Total assets
$
53,095
$
50,472
Liabilities and stockholders
’
equity
Current liabilities:
Short
-
term debt
$
172
$
102
Accounts payable
1,883
2,390
Accrued compensation and benefits
2,448
2,015
Accrued advertising
773
807
Deferred income on shipments to distributors
593
463
Other accrued liabilities
1,636
1,901
Income taxes payable
86
140
Total current liabilities
7,591
7,818
Long-term income taxes payable
193
736
Long
-
term debt
2,049
1,185
Long
-
term deferred tax liabilities
555
46
Other long
-
term liabilities
1,003
1,141
Commitments and contingencies (Notes 22 and 28)
Stockholders
’
equity:
Preferred stock, $0.001 par value, 50 shares authorized; none issued
—
—
Common stock, $0.001 par value, 10,000 shares authorized; 5,523 issued and outstanding (5,562 in
2008) and capital in excess of par value
14,993
13,402
Accumulated other comprehensive income (loss)
393
(393
)
Retained earnings
26,318
26,537
Total stockholders
’
equity
41,704
39,546
Total liabilities and stockholders
’
equity
$
53,095
$
50,472
1
As adjusted due to changes to the accounting for convertible debt instruments. See
“
Note 3: Accounting Changes.
”