Intel 2009 Annual Report Download - page 100
Download and view the complete annual report
Please find page 100 of the 2009 Intel annual report below. You can navigate through the pages in the report by either clicking on the pages listed below, or by using the keyword search tool below to find specific information within the annual report.-
 1
1 -
2
-
3
-
4
-
5
-
6
-
7
-
8
-
9
-
10
-
11
-
12
-
13
-
14
-
15
-
16
-
17
-
18
-
19
-
20
-
21
-
22
-
23
-
24
-
25
-
26
-
27
-
28
-
29
-
30
-
31
-
32
-
33
-
34
-
35
-
36
-
37
-
38
-
39
-
40
-
41
-
42
-
43
-
44
-
45
-
46
-
47
-
48
-
49
-
50
-
51
-
52
-
53
-
54
-
55
-
56
-
57
-
58
-
59
-
60
-
61
-
62
-
63
-
64
-
65
-
66
-
67
-
68
-
69
-
70
-
71
-
72
-
73
-
74
-
75
-
76
-
77
-
78
-
79
-
80
-
81
-
82
-
83
-
84
-
85
-
86
-
87
-
88
-
89
-
 90
90 -
 91
91 -
 92
92 -
 93
93 -
 94
94 -
 95
95 -
 96
96 -
 97
97 -
 98
98 -
 99
99 -
 100
100 -
 101
101 -
 102
102 -
 103
103 -
 104
104 -
 105
105 -
 106
106 -
 107
107 -
 108
108 -
 109
109 -
 110
110 -
111
-
112
-
113
-
114
-
115
-
116
-
117
-
118
-
119
-
120
-
121
-
122
-
123
-
124
-
125
-
126
-
127
-
128
-
129
-
130
-
131
-
132
-
133
-
134
-
135
-
136
-
137
-
138
-
139
-
140
-
141
-
142
-
143
-
144
-
145
-
146
-
147
-
148
-
149
-
150
-
151
-
152
-
153
-
154
-
155
-
156
-
157
-
158
-
159
-
160
-
161
-
162
-
163
-
164
-
165
-
166
-
167
-
168
-
169
-
170
-
171
-
172
 |
 |

Table of Contents
INTEL CORPORATION
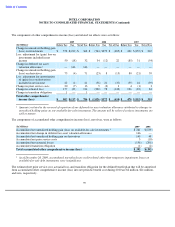
NOTES TO CONSOLIDATED FINANCIAL STATEMENTS (Continued)
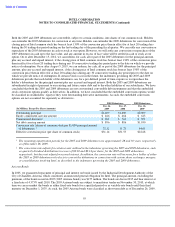
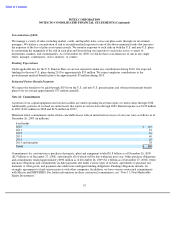
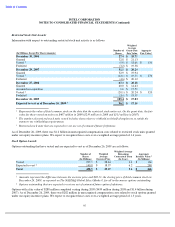
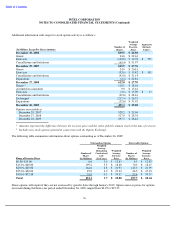
Weighted average actuarial assumptions used to determine costs for the plans were as follows:
For the U.S. plans, we developed the discount rate by calculating the benefit payment streams by year to determine when
benefit payments will be due. We then matched the benefit payment streams by year to the AA corporate bond rates to match
the timing and amount of the expected benefit payments and discounted back to the measurement date to determine the
appropriate discount rate. For the non-U.S. plans, we used two approaches to develop the discount rate. In certain countries,
we used a model consisting of a theoretical bond portfolio for which the timing and amount of cash flows approximated the
estimated benefit payments of our pension plans. In other countries, we analyzed current market long-term bond rates and
matched the bond maturity with the average duration of the pension liabilities. The expected long-term rate of return on plan
assets assumptions take into consideration both duration and risk of the investment portfolios, and are developed through
consensus and building-block methodologies. The consensus methodology includes unadjusted estimates by the fund manager
on future market expectations by broad asset classes and geography. The building-block approach determines the rates of
return implied by historical risk premiums across asset classes. In addition, we analyzed rates of return relevant to the country
where each plan is in effect and the investments applicable to the plan, expectations of future returns, local actuarial
projections, and the projected long-term rates of return from external investment managers. The expected long-term rate of
return on plan assets shown for the non-U.S. plan assets is weighted to reflect each country’s relative portion of the
non-U.S. plan assets.
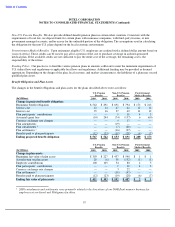
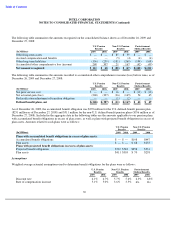
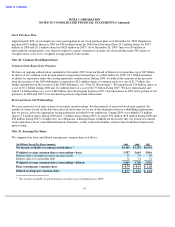
Net Periodic Benefit Cost
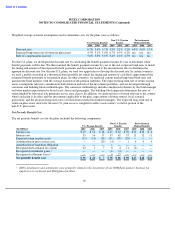
The net periodic benefit cost for the plans included the following components:
89
Non
-
U.S. Pension
Postretirement
U.S. Pension Benefits
Benefits
Medical Benefits
2009
2008
2007
2009
2008
2007
2009
2008
2007
Discount rate
6.7
%
5.6
%
5.5
%
5.5
%
5.2
%
5.2
%
6.8
%
5.6
%
5.5
%
Expected long
-
term rate of return on plan assets
4.5
%
5.1
%
5.6
%
6.7
%
6.5
%
6.2
%
n/a
n/a
n/a
Rate of compensation increase
5.0
%
5.0
%
5.0
%
3.4
%
4.3
%
4.5
%
n/a
n/a
n/a
Non-U.S. Pension
Postretirement
U.S. Pension Benefits
Benefits
Medical Benefits
(In Millions)
2009
2008
2007
2009
2008
2007
2009
2008
2007
Service cost
$
12
$
14
$
18
$
47
$
64
$
70
$
12
$
12
$
6
Interest cost
35
16
17
37
42
37
11
12
11
Expected return on plan assets
(13
)
(11
)
(10
)
(31
)
(39
)
(29
)
—
—
—
Amortization of prior service cost
—
—
(
25
)
(4
)
—
1
4
4
4
Amortization of transition obligation
—
—
—
1
—
—
—
—
—
Recognized net actuarial loss (gain)
22
1
7
8
6
11
(4
)
—
—
Recognized curtailment gains
1
—
—
—
(
6
)
(4
)
—
—
—
—
Recognized settlement losses
1
—
—
—
6
17
—
—
—
—
Net periodic benefit cost
$
56
$
20
$
7
$
58
$
86
$
90
$
23
$
28
$
21
1
2008 curtailments and settlements were primarily related to the divestiture of our NOR flash memory business for
employees at our Israel and Philippines facilities.