Hyundai 2010 Annual Report Download - page 57
Download and view the complete annual report
Please find page 57 of the 2010 Hyundai annual report below. You can navigate through the pages in the report by either clicking on the pages listed below, or by using the keyword search tool below to find specific information within the annual report.-
 1
1 -
2
-
3
-
4
-
5
-
6
-
7
-
8
-
9
-
10
-
11
-
12
-
13
-
14
-
15
-
16
-
17
-
18
-
19
-
20
-
21
-
22
-
23
-
24
-
25
-
26
-
27
-
28
-
29
-
30
-
31
-
32
-
33
-
34
-
35
-
36
-
37
-
38
-
39
-
40
-
41
-
42
-
43
-
44
-
45
-
46
-
 47
47 -
 48
48 -
 49
49 -
 50
50 -
 51
51 -
 52
52 -
 53
53 -
 54
54 -
 55
55 -
 56
56 -
 57
57 -
 58
58 -
 59
59 -
 60
60 -
 61
61 -
 62
62 -
 63
63 -
 64
64 -
 65
65 -
 66
66 -
 67
67 -
68
-
69
-
70
-
71
-
72
-
73
-
74
-
75
-
76
-
77
-
78
-
79
-
80
-
81
-
82
-
83
-
84
 |
 |
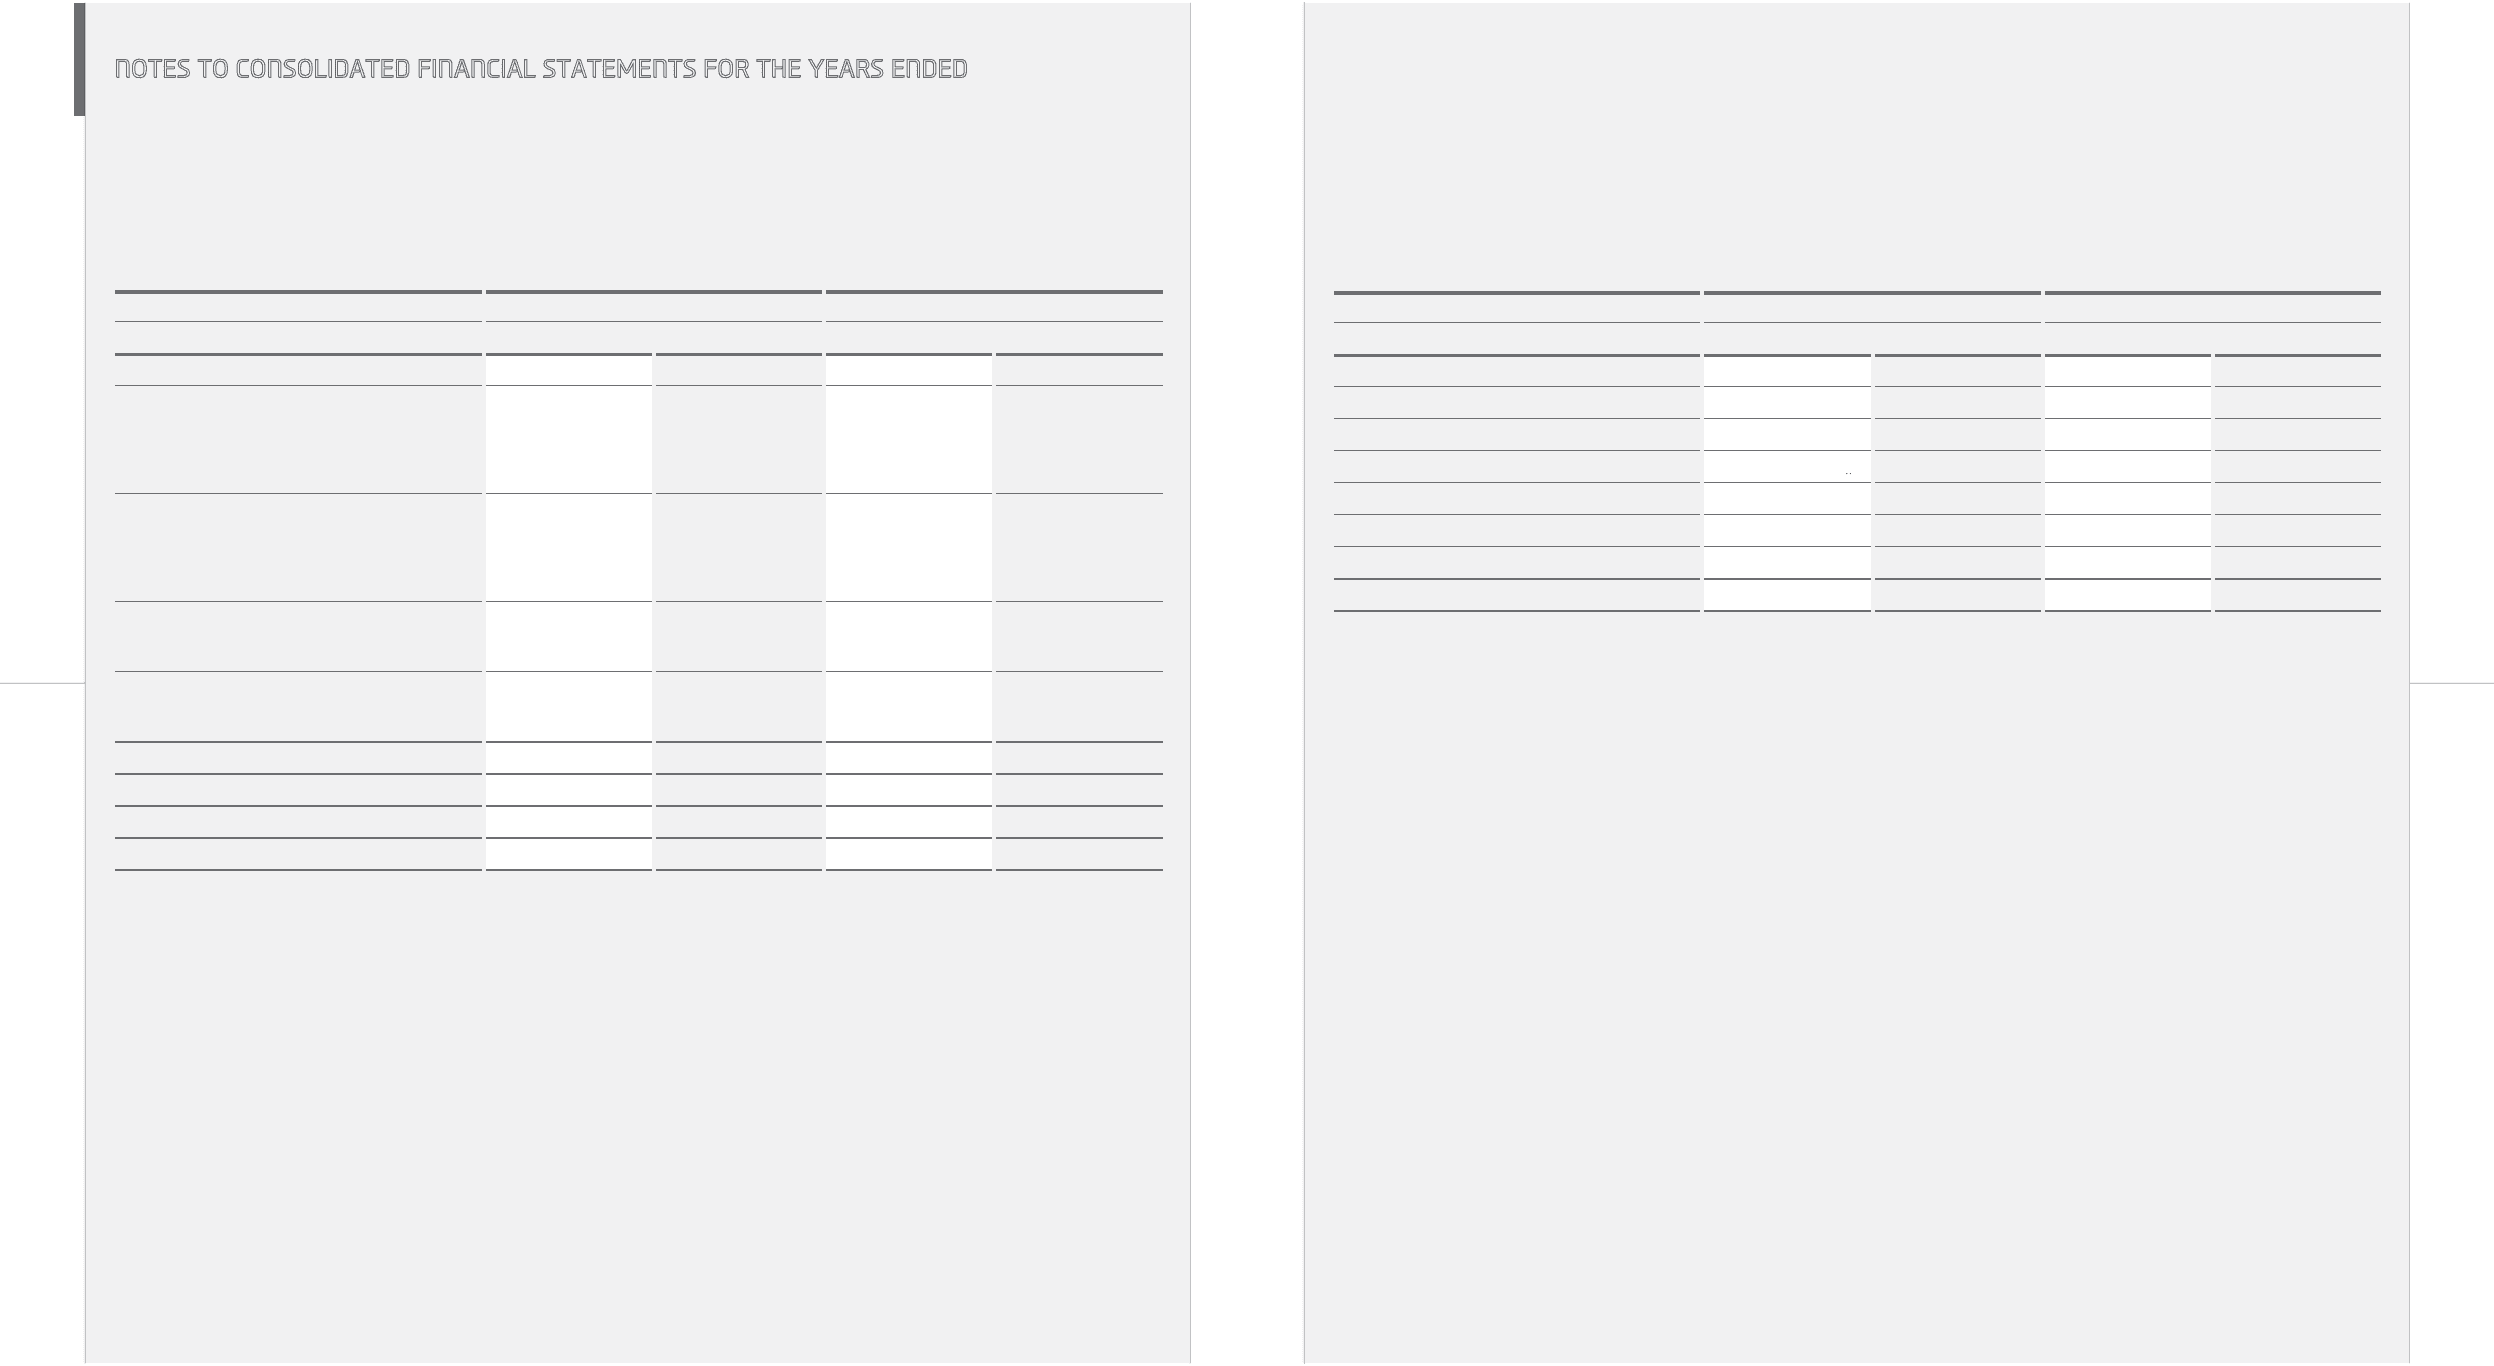
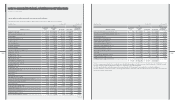
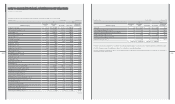
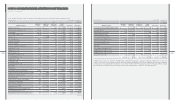
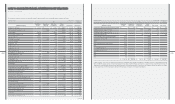
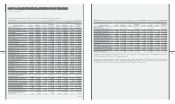
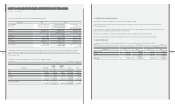
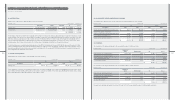
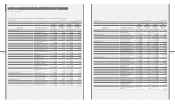
19. INCOME TAX EXPENSE AND DEFERRED INCOME TAX ASSETS (LIABILITIES):
Income tax expense for the year ended December 31, 2010 and 2009 consists of the following:
₩$ (Note 2)
Description 2010 2009 2010 2009
Income tax currently payable ₩ 1,761,734 ₩ 1,053,257 $ 1,546,873 $ 924,802
Changes in deferred taxes due to:
Temporary differences 791,248 433,351 694,748 380,500
Carry forward of unused tax credits 99,354 326 87,237 286
Change in consolidated subsidiaries - 13,537 - 11,886
Deferred tax charged or credited to equity (142,783) 27,735 (125,369) 24,352
Income tax charged or credited to equity (40,359) (10,930) (35,437) (9,597)
Income tax expense ₩ 2,469,194 ₩ 1,517,276 $ 2,168,052 $ 1,332,229
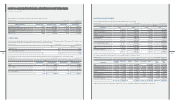
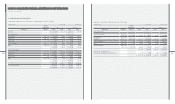
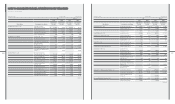
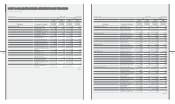
18. STATEMENTS OF COMPREHENSIVE INCOME:
Statements of comprehensive income as of December 31, 2010 and 2009 consist of the following:
₩$ (Note 2)
Description 2010 2009 2010 2009
Net income ₩ 7,982,924 ₩ 4,043,436 $ 7,009,328 $ 3,550,299
Other comprehensive income (loss):
Gain on valuation of available-for-sale
securities, net of deferred tax effect
₩144,671 million and ₩1,713 million
in 2010 and 2009, respectively. 512,926 6,074 450,370 5,333
Gain (loss) on valuation of investment
securities accounted for using the equity
method, net of deferred tax effect
₩18,481 million and ₩21,976 million
in 2010 and 2009, respectively. (65,524) 90,975 (57,533) 79,880
Gain on valuation of derivatives, net of
deferred tax effect ₩23,812 million and
₩81,554 million in 2010 and 2009, respectively. 83,789 281,861 73,570 247,485
Loss on overseas operation translation, net
of deferred tax effect ₩8,832 million
and ₩136,782 million in 2010 and 2009, respectively. (31,309) (466,046) (27,490) (409,207)
Comprehensive income ₩ 8,482,806 ₩ 3,956,300 $ 7,448,245 $ 3,473,790
Equity holders of the parent ₩ 5,926,515 ₩ 2,861,134 $ 5,203,719 $ 2,512,191
Minority interests 2,556,291 1,095,166 2,244,526 961,599
₩ 8,482,806 ₩ 3,956,300 $ 7,448,245 $ 3,473,790
[in millions of KRW]Hyundai Motor Company [in thousands of US$]
December 31, 2010 and 2009
[in millions of KRW]Hyundai Motor Company [in thousands of US$]