Hyundai 2010 Annual Report Download - page 47
Download and view the complete annual report
Please find page 47 of the 2010 Hyundai annual report below. You can navigate through the pages in the report by either clicking on the pages listed below, or by using the keyword search tool below to find specific information within the annual report.-
 1
1 -
2
-
3
-
4
-
5
-
6
-
7
-
8
-
9
-
10
-
11
-
12
-
13
-
14
-
15
-
16
-
17
-
18
-
19
-
20
-
21
-
22
-
23
-
24
-
25
-
26
-
27
-
28
-
29
-
30
-
31
-
32
-
33
-
34
-
35
-
36
-
 37
37 -
 38
38 -
 39
39 -
 40
40 -
 41
41 -
 42
42 -
 43
43 -
 44
44 -
 45
45 -
 46
46 -
 47
47 -
 48
48 -
 49
49 -
 50
50 -
 51
51 -
 52
52 -
 53
53 -
 54
54 -
 55
55 -
 56
56 -
 57
57 -
58
-
59
-
60
-
61
-
62
-
63
-
64
-
65
-
66
-
67
-
68
-
69
-
70
-
71
-
72
-
73
-
74
-
75
-
76
-
77
-
78
-
79
-
80
-
81
-
82
-
83
-
84
 |
 |

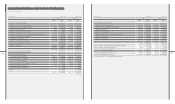
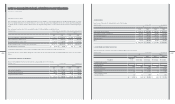
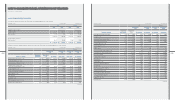
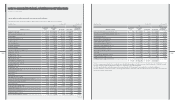
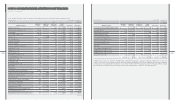
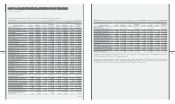
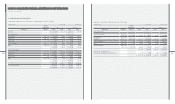
7. INVESTMENT SECURITIES ACCOUNTED FOR USING THE EQUITY METHOD:
(1) Investment securities accounted for using the equity method as of December 31, 2010 consist of the following:
₩ $ (Note 2)
Acquisition Net equity Ownership
Afliated company cost value Book value Book value percentage (*2)
Hyundai Steel Company ₩ 245,153 ₩ 1,587,977 ₩ 1,370,753 $ 1,203,576 21.29
HMC Investment Securities Co., Ltd. 215,284 182,278 222,947 195,756 29.95
Hyundai MOBIS 215,012 1,312,189 1,331,547 1,169,152 16.88
Korea Aerospace Industries, Ltd 159,800 125,926 125,782 110,442 22.23
Glovis Co., Ltd. (*4) 99,259 30,292 103,721 91,071 2.70
Eukor Car Carriers Inc. 48,912 136,787 125,476 110,173 20.00
HK Mutual Savings Bank 45,719 30,601 42,142 37,002 20.00
Korea Economy Daily 34,141 33,508 35,485 31,157 24.90
Automobile Industrial Ace Corporation (*3) 26,107 26,997 14,000 12,293 100.00
Kia Tigers Co., Ltd. (*1) 20,300 (48) - - 100.00
Donghui Auto Co., Ltd. 10,530 11,175 11,175 9,812 35.10
Hyundai Amco Co., Ltd. (*4) 10,067 84,053 84,053 73,802 19.99
TRW Steering Co., Ltd. 8,952 6,668 6,668 5,855 29.00
WIA-MAGNA Power Train Co., Ltd. 7,500 5,384 5,454 4,789 50.00
Korea Credit Bureau Co., Ltd. (*4) 4,800 3,185 4,454 3,911 9.00
Hyundai Wisco Co., Ltd. 1,736 31,453 30,196 26,513 38.63
Iljin Bearing Co., Ltd. 826 20,635 20,635 18,118 20.00
Daesung Automotive Co., Ltd. 400 14,855 14,855 13,043 20.00
MAINTRANCE (*1) 400 2,132 2,132 1,872 80.00
HI Network Inc. 76 1,055 1,055 926 20.00
Beijing-Hyundai Motor Company 417,163 1,233,430 1,224,189 1,074,887 50.00
Hyundai Motor Brasil Montadora de Automoveis LTDA (*1) 30,003 30,003 30,003 26,344 100.00
KEFICO Vietnam Company Limited (*1) 26,358 21,297 19,177 16,838 100.00
Sewon America, Inc. 15,090 11,096 11,096 9,743 40.00
Hyundai Motor Deutschland GmbH 11,528 34,755 34,404 30,208 35.29
Hyundai Motor Hungary (*2) 5,415 - - - 100.00
Autoever Systems America, Inc. (*1) 4,642 4,962 4,962 4,357 100.00
Hyundai-Wia India PVT LTD (*1) 4,506 4,537 4,537 3,984 100.00
Dymos Powertrain System Co., Ltd. (*1) 3,172 3,248 3,248 2,852 100.00
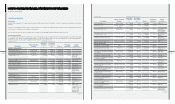
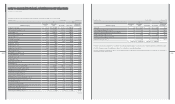
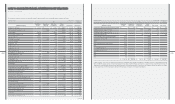
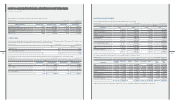
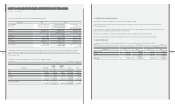
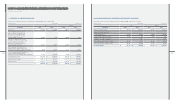
(continued)
₩ $ (Note 2)
Acquisition Net equity Ownership
Afliated company cost value Book value Book value percentage (*2)
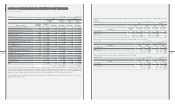
Beijing Lear Dymos Automotive Systems Co., Ltd. ₩ 2,662 ₩ 12,000 ₩ 12,000 $ 10,536 40.00
Dymos Fabricacao DE AUTO PECAS BRASIL LTDA (*1) 2,099 2,006 2,006 1,761 100.00
Yan Ji Kia Motors A/S (*1) 1,792 1,792 1,792 1,573 100.00
Hyundai Capital Germany GmbH (*1) 1,669 1,512 1,669 1,465 50.01
Hyundai Capital Europe GmbH (*1) 1,668 1,005 1,668 1,465 100.00
Autoever Systems Europe GmbH (*1) 1,534 4,942 4,942 4,339 100.00
Hyundai Motor Japan R&D Center Inc. (*1) 1,510 3,266 3,266 2,868 100.00
Autoever Systems China Co., Ltd. (*1) 538 1,428 1,428 1,254 90.00
Autoever Systems India Pvt. Ltd. (*1) 520 1,612 1,612 1,415 100.00
South Link9 200 1,291 1,291 1,135 20.00
Rotem Equipments (Beijing) Co., Ltd. (*1) 190 120 120 106 100.00
EUKOR Shipowning Singapore Pte Ltd. 8 5,047 4,139 3,635 20.00
EUKOR Car Carriers Singapore Pte Ltd.(*4) 5 5 5 4 8.00
₩ 1,687,246 ₩ 5,026,456 ₩ 4,920,084 $ 4,320,032
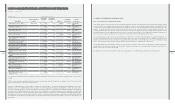
(*1) These companies are excluded in the consolidation since individual beginning balance of total assets is less than ₩10,000 million (US$8,780 thousand).
(*2) As the Company is under the liquidation procedures, it is excluded from consolidated subsidiaries.
(*3) As the parent-subsidiary relationship is expected to be discontinued in the following year, it was excluded from consolidated subsidiaries.
(*4) As the Company is considered to be able to exercise signicant inuence, although the total ownership percentage is less than 20%, the investment is
accounted for using the equity method.
[in millions of KRW]Hyundai Motor Company [in thousands of US$] [in millions of KRW]Hyundai Motor Company [in thousands of US$]
December 31, 2010 and 2009