Hyundai 2010 Annual Report Download - page 54
Download and view the complete annual report
Please find page 54 of the 2010 Hyundai annual report below. You can navigate through the pages in the report by either clicking on the pages listed below, or by using the keyword search tool below to find specific information within the annual report.-
 1
1 -
2
-
3
-
4
-
5
-
6
-
7
-
8
-
9
-
10
-
11
-
12
-
13
-
14
-
15
-
16
-
17
-
18
-
19
-
20
-
21
-
22
-
23
-
24
-
25
-
26
-
27
-
28
-
29
-
30
-
31
-
32
-
33
-
34
-
35
-
36
-
37
-
38
-
39
-
40
-
41
-
42
-
43
-
 44
44 -
 45
45 -
 46
46 -
 47
47 -
 48
48 -
 49
49 -
 50
50 -
 51
51 -
 52
52 -
 53
53 -
 54
54 -
 55
55 -
 56
56 -
 57
57 -
 58
58 -
 59
59 -
 60
60 -
 61
61 -
 62
62 -
 63
63 -
 64
64 -
65
-
66
-
67
-
68
-
69
-
70
-
71
-
72
-
73
-
74
-
75
-
76
-
77
-
78
-
79
-
80
-
81
-
82
-
83
-
84
 |
 |
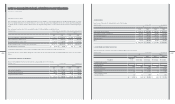
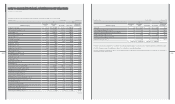
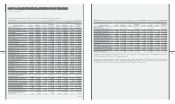
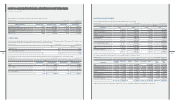
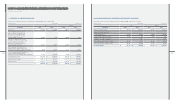
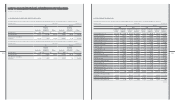
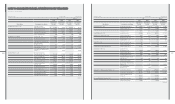
13. OTHER FINANCIAL BUSINESS ASSETS AND LIABILITIES:
Other nancial business assets as of December 31, 2010 and 2009 consist of the following:
₩$ (Note 2)
2010 2009 2010 2009
Finance receivables ₩ 19,894,575 ₩ 15,716,002 $ 17,468,237 $ 13,799,282
Lease receivables 4,332,728 2,605,930 3,804,309 2,288,111
Card receivables 8,273,990 6,074,074 7,264,896 5,333,281
Other 2,111,452 1,319,669 1,853,940 1,158,723
₩ 34,612,745 ₩ 25,715,675 $ 30,391,382 $ 22,579,397
Total amounts of other nancial business liabilities as of December 31, 2010 and 2009 consist of other operating accounts payables.
Hyundai Capital Services Inc., Hyundai Card Co., Ltd., Hyundai Commercial Inc., HMC win win fund, Hyundai Capital America (HCA) and Hyundai
Auto Canada Captive Insurance Incorporation (HACCI), are the Company’s subsidiaries in nancial and insurance services industry for the years
ended December 31, 2010 and 2009.
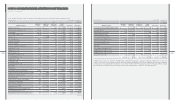
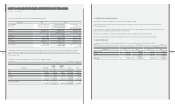
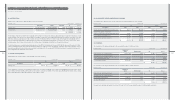
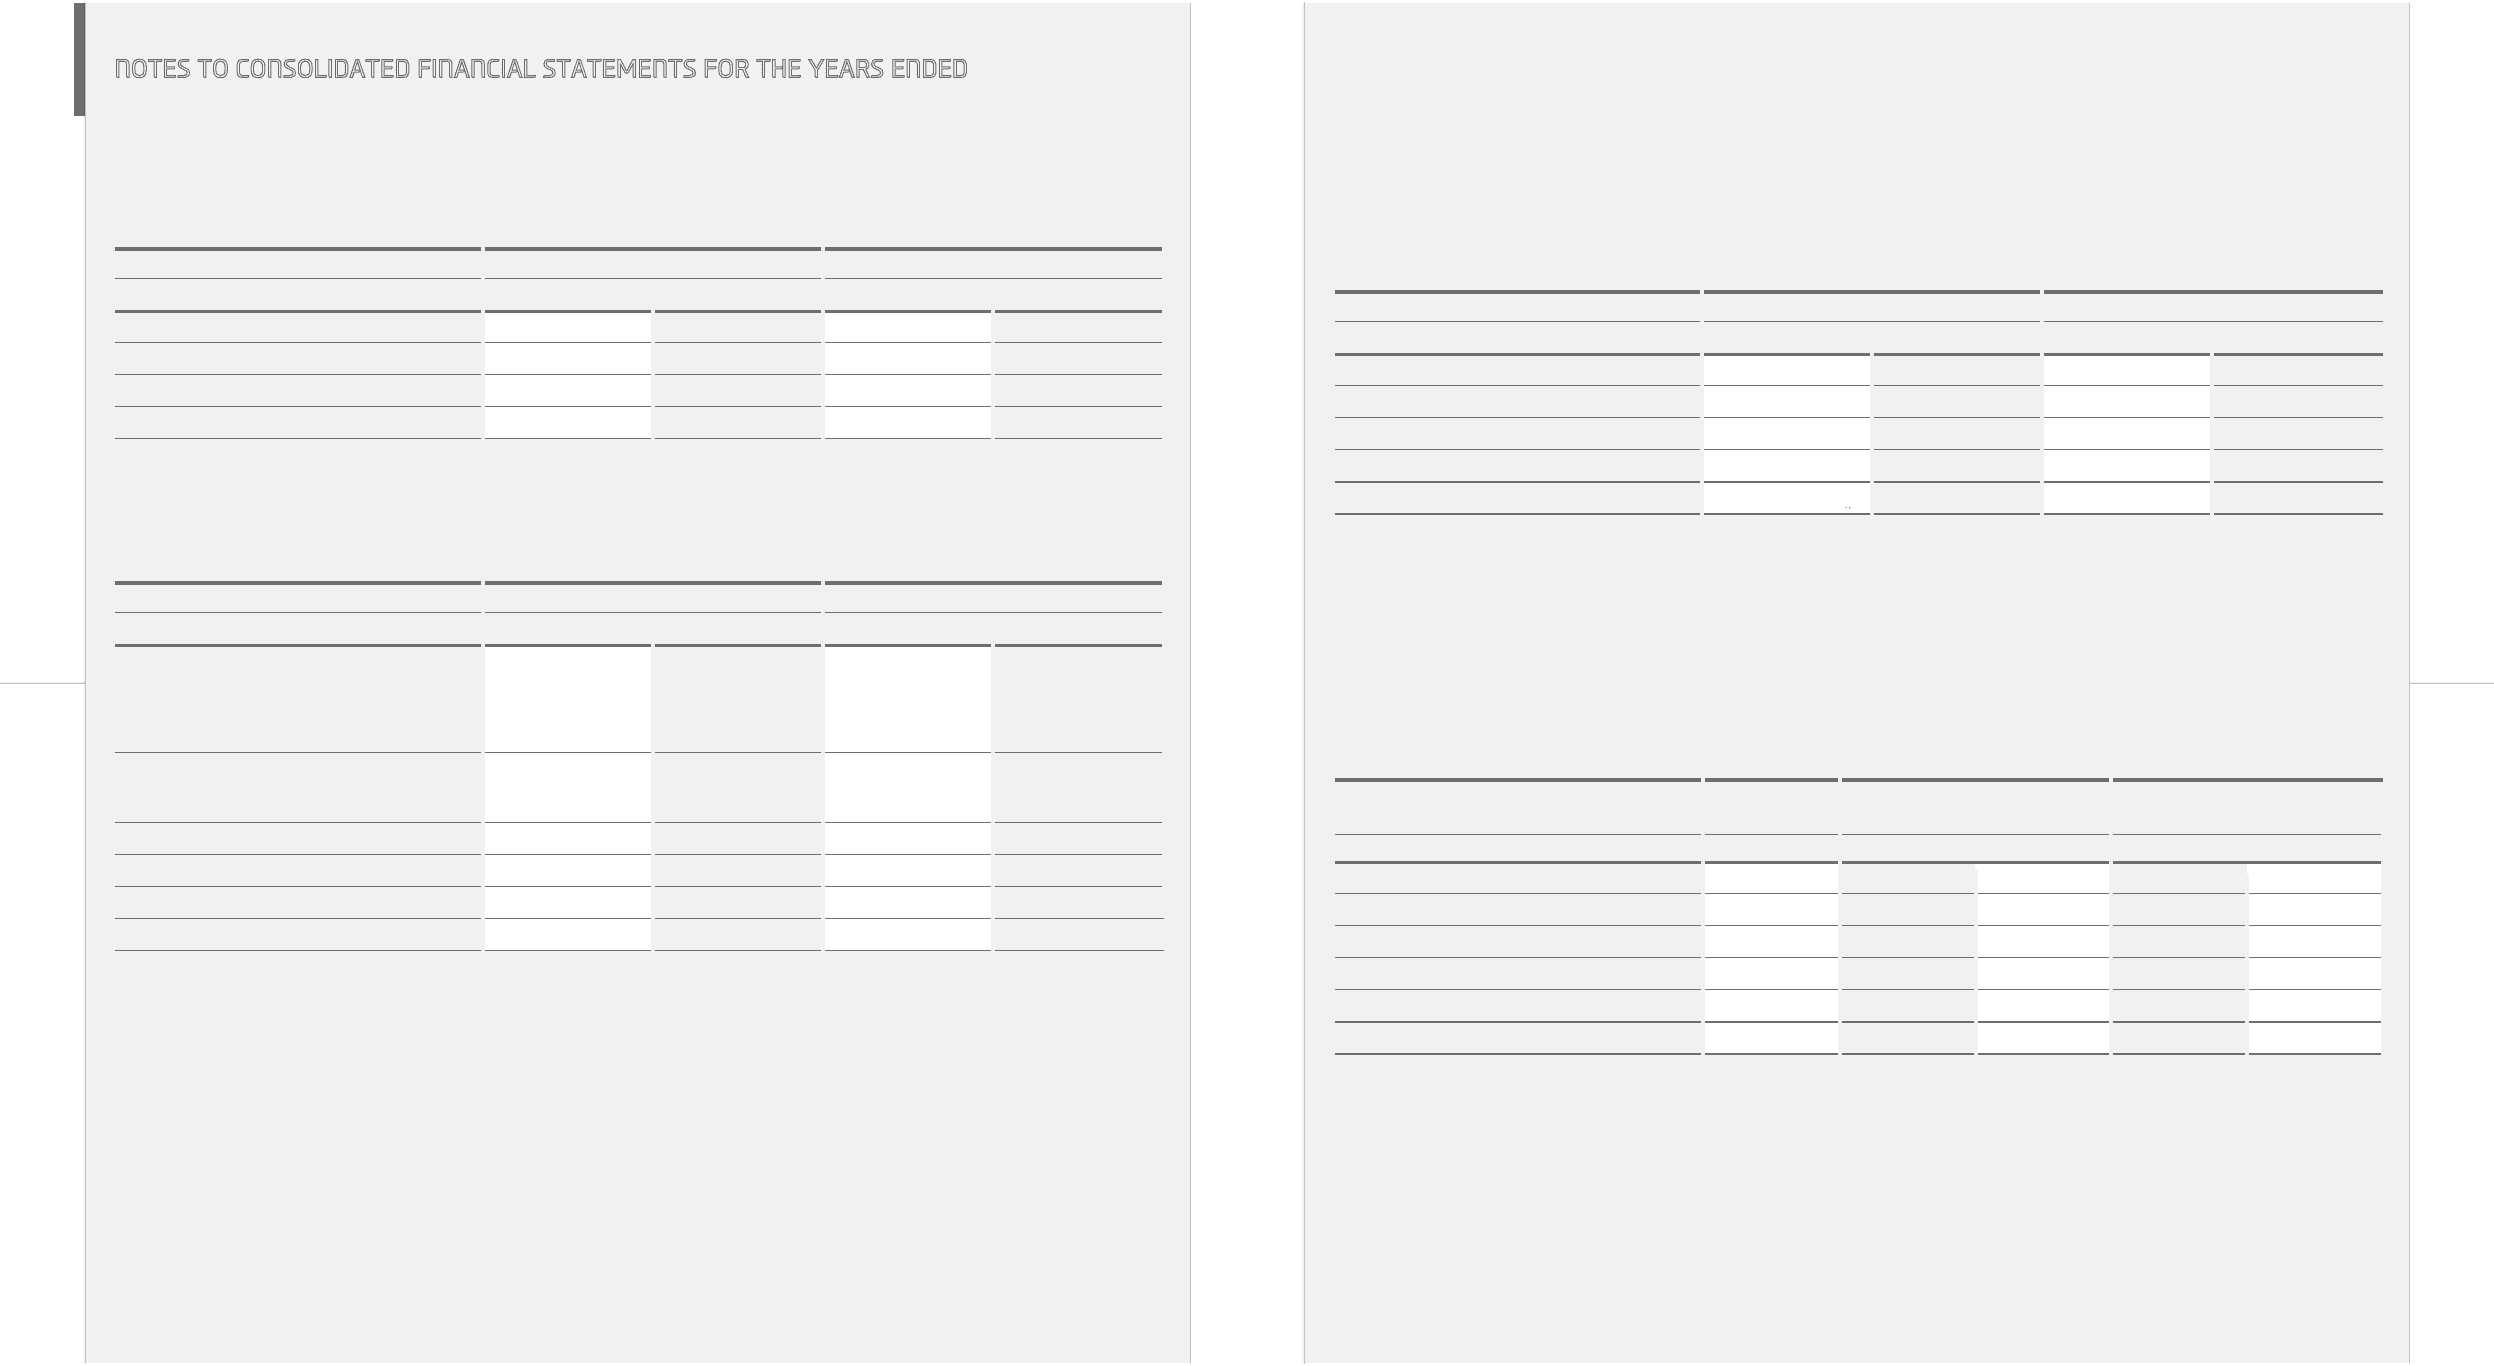
14. SHORT-TERM BORROWINGS:
Short-term borrowings as of December 31, 2010 and 2009 consist of the following:
Annual
interestrate ₩ $ (Note 2)
Description 2010(%) 2010 2009 2010 2009
General loans 0.72 ~ 7.30 ₩ 3,388,365 ₩ 4,128,803 $ 2,975,121 $ 3,625,255
Discount of trade bills 2.72 ~ 5.57 4,618,258 2,706,585 4,055,016 2,376,490
Banker’s Usance 1.10 ~ 5.74 620,720 663,066 545,017 582,199
Overdrafts 1.52 ~ 3.50 196,165 213,555 172,241 187,510
Trade nancing 1.90 ~ 6.13 3,310,348 5,237,016 2,906,619 4,598,311
₩ 12,133,856 ₩ 12,949,025 $ 10,654,014 $ 11,369,765
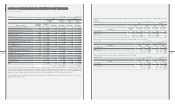
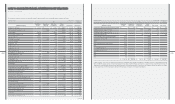
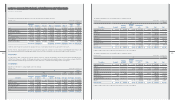
Research and development expenditures for the year ended December 31, 2010 and 2009 are as follows:
₩$ (Note 2)
2010 2009 2010 2009
Development cost ₩ 1,194,163 ₩ 1,360,814 $ 1,048,523 $ 1,194,849
Ordinary development (manufacturing cost) 269,717 215,273 236,822 189,019
Research costs (SG&A) 952,324 663,384 836,179 582,478
₩ 2,416,204 ₩ 2,239,471 $ 2,121,524 $ 1,966,346
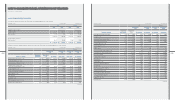
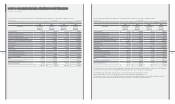
12. OTHER ASSETS:
Other assets as of December 31, 2010 and 2009 consist of the following:
₩$ (Note 2)
2010 2009 2010 2009
Long-term notes and accounts receivable,
net of allowance for doubtful accounts of
₩479 million in 2010 and ₩617 million in
2009, and unamortized present value discount
of ₩8,671 million in 2010 and ₩11,259 million in 2009 ₩ 57,099 ₩ 62,172 $ 50,135 $ 54,590
Long-term notes and accounts receivable - other,
net of allowance for doubtful accounts of
₩319 million in 2010 and ₩936 million in 2009 94,065 170,735 82,593 149,912
Long-term loans 17,928 11,547 15,742 10,139
Long-term deposits 532,312 545,253 467,391 478,754
Other 209,529 184,232 183,974 161,763
₩ 910,933 ₩ 973,939 $ 799,835 $ 855,158
[in millions of KRW]Hyundai Motor Company [in thousands of US$]
[in millions of KRW]Hyundai Motor Company [in thousands of US$]
[in millions of KRW]Hyundai Motor Company [in thousands of US$]
[in millions of KRW]Hyundai Motor Company [in thousands of US$]
December 31, 2010 and 2009