Hyundai 2010 Annual Report Download - page 35
Download and view the complete annual report
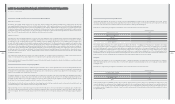
Please find page 35 of the 2010 Hyundai annual report below. You can navigate through the pages in the report by either clicking on the pages listed below, or by using the keyword search tool below to find specific information within the annual report.-
 1
1 -
2
-
3
-
4
-
5
-
6
-
7
-
8
-
9
-
10
-
11
-
12
-
13
-
14
-
15
-
16
-
17
-
18
-
19
-
20
-
21
-
22
-
23
-
24
-
 25
25 -
 26
26 -
 27
27 -
 28
28 -
 29
29 -
 30
30 -
 31
31 -
 32
32 -
 33
33 -
 34
34 -
 35
35 -
 36
36 -
 37
37 -
 38
38 -
 39
39 -
 40
40 -
 41
41 -
 42
42 -
 43
43 -
 44
44 -
 45
45 -
46
-
47
-
48
-
49
-
50
-
51
-
52
-
53
-
54
-
55
-
56
-
57
-
58
-
59
-
60
-
61
-
62
-
63
-
64
-
65
-
66
-
67
-
68
-
69
-
70
-
71
-
72
-
73
-
74
-
75
-
76
-
77
-
78
-
79
-
80
-
81
-
82
-
83
-
84
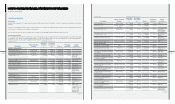
 |
 |

₩$ (Note 2)
Accumulated
other
Capital Capital Capital
comprehensive
Retained Minority Total Total
stock surplus adjustments
income
earnings interests amount amount
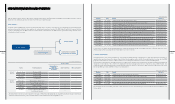
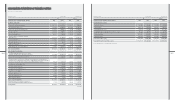
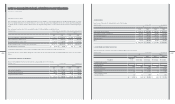
Balance at January 1, 2009 ₩ 1,488,993 ₩ 5,839,874 ₩ (719,235) ₩ 618,309 ₩ 11,841,859 ₩ 6,282,097 ₩ 25,351,897$ 22,259,985
Payment of cash dividends(Note 23)
(235,715) (41,181) (276,896) (243,126)
Purchase of treasury stock (25,424) (25,424) (22,323)
Disposal of treasury Stock 881 1,200 2,081 1,827
Disposal of subsidiaries’ stock 36,278 119 36,397 31,958
Increase in subsidiaries’
capital-stock (86,113) 373,633 287,520 252,454
Effect of changes in
consolidation scope (18) (497,844) (497,862) (437,143)
Net income 2,973,473 1,069,963 4,043,436 3,550,299
Gain on valuation of available-
for-sale securities, net 6,150 6,150 5,400
Gain on valuation of
investment equity
securities, net 43,251 43,251 37,976
Gain on valuation of
derivatives, net 211,675 211,675 185,859
Loss on overseas
operation translation (373,415) (373,415) (327,873)
Others 2,587 (450) 38,035 112,678 152,850 134,209
Balance at December 31, 2009
₩ 1,488,993 ₩ 5,793,489 ₩ (743,909) ₩ 505,970 ₩14,617,652 ₩ 7,299,465 ₩28,961,660 $ 25,429,502
(Continued)
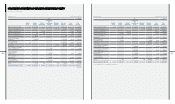
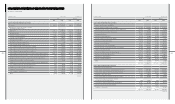
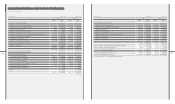
December 31, 2010 and 2009
₩$ (Note 2)
Accumulated
other
Capital Capital Capital
comprehensive
Retained Minority Total Total
stock surplus adjustments
income
earnings interests amount amount
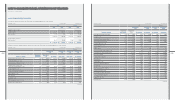
Balance at January 1, 2010 ₩ 1,488,993 ₩ 5,793,489 ₩ (743,909) ₩ 505,970 ₩ 14,617,652 ₩ 7,299,465 ₩ 28,961,660
$
25,429,502
Payment of cash dividends (Note 23)
(317,199) (341,940) (659,139) (578,751)
Purchase of treasury stock (452,515) (452,515) (397,326)
Disposal of treasury Stock 171,109 278,210 449,319 394,520
Increase in subsidiaries’
capital-stock 1,981 102,589 104,570 91,817
Effect of changes in
consolidation scope (5,847) (4,897) (10,744) (9,434)
Net income 5,441,279 2,541,645 7,982,924 7,009,328
Gain on valuation of available-
for-sale securities, net 520,086 520,086 456,656
Loss on valuation of investment
equity securities, net
(65,524) (65,524) (57,533)
Gain on valuation of
derivatives, net 72,843 72,843 63,959
Loss on overseas
operation translation (42,169) (42,169) (37,026)
Others 478 695 (126,883) (125,710) (110,377)
Balance at December 31, 2010
₩ 1,488,993 ₩ 5,961,210 ₩ (918,214) ₩ 991,206 ₩19,742,427 ₩ 9,469,979 ₩36,735,601 $ 32,255,335
See accompanying notes to consolidated nancial statements.
[in millions of KRW]
Hyundai Motor Company
[in thousands of US$] [in thousands of US$]
Hyundai Motor Company
[in millions of KRW]