Hyundai 2010 Annual Report Download - page 36
Download and view the complete annual report
Please find page 36 of the 2010 Hyundai annual report below. You can navigate through the pages in the report by either clicking on the pages listed below, or by using the keyword search tool below to find specific information within the annual report.-
 1
1 -
2
-
3
-
4
-
5
-
6
-
7
-
8
-
9
-
10
-
11
-
12
-
13
-
14
-
15
-
16
-
17
-
18
-
19
-
20
-
21
-
22
-
23
-
24
-
25
-
 26
26 -
 27
27 -
 28
28 -
 29
29 -
 30
30 -
 31
31 -
 32
32 -
 33
33 -
 34
34 -
 35
35 -
 36
36 -
 37
37 -
 38
38 -
 39
39 -
 40
40 -
 41
41 -
 42
42 -
 43
43 -
 44
44 -
 45
45 -
 46
46 -
47
-
48
-
49
-
50
-
51
-
52
-
53
-
54
-
55
-
56
-
57
-
58
-
59
-
60
-
61
-
62
-
63
-
64
-
65
-
66
-
67
-
68
-
69
-
70
-
71
-
72
-
73
-
74
-
75
-
76
-
77
-
78
-
79
-
80
-
81
-
82
-
83
-
84
 |
 |
₩$ (Note 2)
2010 2009 2010 2009
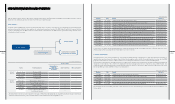
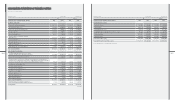
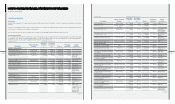
CASH FLOWS FROM OPERATING ACTIVITIES:
Net income ₩ 7,982,924 ₩ 4,043,436 $ 7,009,328 $ 3,550,299
Adjustments to reconcile net income to net cash
provided by operating activities:
Depreciation 2,986,730 2,668,623 2,622,469 2,343,158
Bad debt expenses 331,711 337,220 291,256 296,093
Provision for severance benets 756,413 713,547 664,161 626,523
Provision for accrued warranties 1,658,970 889,827 1,456,642 781,304
Amortization of intangibles 896,180 913,935 786,882 802,472
Amortization of discount on debentures 1,537 1,481 1,350 1,300
Gain on foreign exchange translation, net (167,499) (483,474) (147,071) (424,510)
Loss on disposal of trade notes and accounts receivable 36,968 126,119 32,459 110,738
Gain on disposal of short-term investment securities, net (20,633) (16,997) (18,117) (14,924)
Gain on disposal of long-term investment securities, net (105,736) (59,159) (92,840) (51,944)
Gain on valuation of investment securities accounted for using the equity method, net
(1,095,173) (914,103) (961,606) (802,619)
Gain on disposal of investment securities accounted for using the equity method, net
(7,267) (118,751) (6,381) (104,268)
Dividends of investment securities accounted for using the equity method 310,994 125,132 273,065 109,871
Impairment loss on long-term investment securities 18,720 12,230 16,437 10,738
Impairment loss on investment securities accounted for using the equity method 2,283 - 2,005 -
Loss on disposal of property, plant and equipment, net 127,223 40,943 111,707 35,950
Impairment loss on property, plant and equipment 27,835 61,376 24,440 53,891
Impairment loss on intangibles 117,038 150,284 102,764 131,955
Loss on valuation of derivatives, net 84,117 475,251 73,858 417,289
Other (70,038) 143,543 (61,496) 126,037
(Continued)
December 31, 2010 and 2009
₩$ (Note 2)
2010 2009 2010 2009
CASH FLOWS FROM OPERATING ACTIVITIES:
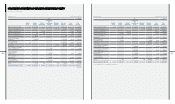
Changes in operating assets and liabilities:
Increase in trade notes and accounts receivable ₩ (1,321,966) ₩ (239,555) $ (1,160,739) $ (210,339)
Decrease (increase) in trade notes and accounts receivable-other (361,761) 174,990 (317,641) 153,648
Increase in advances and other current assets (190,238) (147,432) (167,037) (129,451)
Decrease in inventories 158,973 5,149,189 139,585 4,521,195
Decrease in deferred tax assets 571,214 373,989 501,549 328,377
Increase in trade notes and accounts payable 2,144,228 156,201 1,882,718 137,151
Increase in accounts payable-other 1,159,312 301,479 1,017,923 264,711
Increase in accrued expenses 104,732 570,984 91,959 501,347
Increase (decrease) in income tax payable 782,883 (252,477) 687,403 (221,685)
Increase (decrease) in withholding and other current liabilities (185,490) 309,970 (162,868) 272,166
Payment of severance benets (636,966) (602,326) (559,282) (528,866)
Increase in individual severance insurance deposits (137,416) (286,644) (120,657) (251,685)
Decrease in long-term unearned income (152,551) (20,134) (133,946) (17,678)
Decrease in accrued warranties (512,656) (1,002,217) (450,133) (879,987)
Increase in deferred tax liabilities 929,861 114,696 816,455 100,708
Other 596,520 247,601 523,770 217,403
16,821,976 13,958,777 14,770,371 12,256,368
CASH FLOWS FROM INVESTING ACTIVITIES:
Cash inows from investing activities:
Proceeds from withdrawal of short-term nancial instruments 8,158,554 3,781,008 7,163,539 3,319,877
Proceeds from disposal of short-term investment securities 323,878 1,310,313 284,378 1,150,508
Reduction in other current assets 16,669 100,017 14,636 87,819
Proceeds from disposal of long-term investment securities 6,209 406,056 5,452 356,533
Proceeds from disposal of investment securities
accounted for using the equity method 7,349 118,677 6,453 104,203
Proceeds from disposal of property, plant and equipment 332,847 481,954 292,253 423,175
Increase in other nancial business liabilities 78,794 - 69,184 -
Reduction in other assets 98,811 633,334 86,759 556,093
9,023,111 6,831,359 7,922,654 5,998,208
(Continued)
[in millions of KRW]Hyundai Motor Company [in thousands of US$] [in millions of KRW]Hyundai Motor Company [in thousands of US$]