Hyundai 2004 Annual Report Download - page 55
Download and view the complete annual report
Please find page 55 of the 2004 Hyundai annual report below. You can navigate through the pages in the report by either clicking on the pages listed below, or by using the keyword search tool below to find specific information within the annual report.-
 1
1 -
2
-
3
-
4
-
5
-
6
-
7
-
8
-
9
-
10
-
11
-
12
-
13
-
14
-
15
-
16
-
17
-
18
-
19
-
20
-
21
-
22
-
23
-
24
-
25
-
26
-
27
-
28
-
29
-
30
-
31
-
32
-
33
-
34
-
35
-
36
-
37
-
38
-
39
-
40
-
41
-
42
-
43
-
44
-
 45
45 -
 46
46 -
 47
47 -
 48
48 -
 49
49 -
 50
50 -
 51
51 -
 52
52 -
 53
53 -
 54
54 -
 55
55 -
 56
56 -
 57
57 -
 58
58 -
 59
59 -
 60
60 -
 61
61 -
 62
62 -
 63
63 -
 64
64 -
 65
65
 |
 |

Hyundai Motor Company Annual Report 2004_108
HYUNDAI MOTOR COMPANY AND SUBSIDIARIES
NOTES TO CONSOLIDATED FINANCIAL STATEMENTS DECEMBER 31, 2004 AND 2003
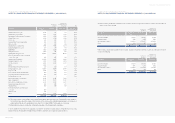
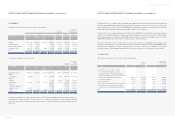
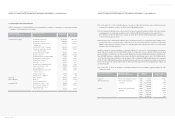
As of December 31, 2004, accumulated temporary differences of the Company and its subsidiaries amount to 4,231,280 million
(US$4,053,727 thousand) and net operating loss carry-forwards and tax exemption carry-forwards of subsidiaries amount to
1,907,444 million (US$1,827,404 thousand) and 215,098 million (US$113,540 thousand), respectively. Some portion of the
temporary difference, net operating loss carry-forwards and tax exemption carry-forwards, which are more likely than not, were not
recognized as deferred tax assets. Deferred tax assets were calculated using the expected tax rate (27.5%) with residual temporary
differences. As of December 31, 2004 and 2003, deferred tax assets amount to 2,357,859 million (US$2,258,918 thousand) and
2,509,050 million (US$2,403,765 thousand), respectively and deferred tax liabilities amount to 1,036,499 million (US$993,005
thousand) and 911,537 million (US$873,287 thousand), respectively.
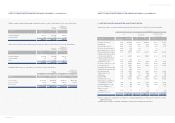
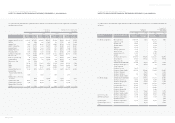
20. DIVIDENDS:
The computation of the proposed dividends for 2004 is as follows:
Number of Dividend rate Korean won
Translation into
shares (in millions)
U.S. dollars(Note 2)
(in thousands)
Common shares, net of treasury shares 217,807,392 23% 250,479 $239,968
Preferred shares, net of treasury shares:
First and Third preferred shares 24,492,541 24% 29,391 28,158
Second preferred shares 37,571,005 25% 46,963 44,992
326,833 $313,118
The computation of the proposed dividends for 2003 is as follows:
Number of Dividend rate Korean won
Translation into
shares (in millions)
U.S. dollars(Note 2)
(in thousands)
Common shares, net of treasury shares 218,629,032 20% 218,629 $209,455
Preferred shares, net of treasury shares:
First and Third preferred shares 24,492,541 21% 25,717 24,638
Second preferred shares 37,571,005 22% 41,328 39,594
285,674 $273,687
The proposed dividends for 2004 and 2003 were approved at the shareholders’ meeting on March 4, 2005 and March 12, 2004,
respectively.
HYUNDAI MOTOR COMPANY AND SUBSIDIARIES
NOTES TO CONSOLIDATED FINANCIAL STATEMENTS DECEMBER 31, 2004 AND 2003
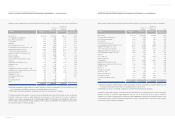
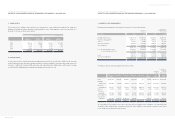
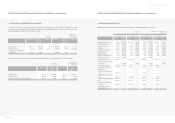
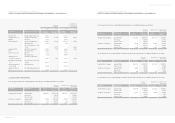
18. SELLING AND ADMINISTRATIVE EXPENSES:
Selling and administrative expenses are as follows:
Korean won
(in millions)
Translation into
U. S. dollars (Note 2)
(in thousands)
2004 2003 2004 2003
Salaries 1,925,695 1,728,168 $1,844,889 $1,655,651
Export related expenses 1,238,938 925,061 1,186,950 886,243
Sales promotion 1,903,907 2,320,814 1,824,015 2,223,428
Sales commission 531,333 403,840 509,037 386,894
Sales warranties 2,084,101 2,028,818 1,996,648 1,943,684
Taxes and dues 59,088 55,574 56,609 53,242
Communications 78,058 79,475 74,783 76,140
Utilities 47,866 46,065 45,857 44,132
Freight and warehousing 202,529 145,941 194,030 139,817
Rent 65,630 73,693 62,876 70,601
Travel 125,297 114,055 120,039 109,269
Service charges 784,157 539,698 751,252 517,051
Supplies 99,045 84,031 94,889 80,505
Research 628,237 478,197 601,875 458,131
Depreciation 213,053 219,658 204,113 210,441
Amortization 217,691 233,051 208,556 223,272
Provision for bad debt 933,732 1,532,102 894,551 1,467,812
Other 160,685 84,600 153,942 81,050
11,299,042 11,092,841 $10,824,911 $10,627,363
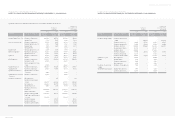
19.INCOME TAX EXPENSE AND DEFERRED INCOME TAX ASSETS (LIABILITIES):
Income tax expense in 2004 and 2003 consists of the following:
Korean won
(in millions)
Translation into
U. S. dollars (Note 2)
(in thousands)
Description 2004 2003 2004 2003
Income tax currently payable 846,929 1,145,758 $811,390 $1,097,680
Changes in deferred income taxes due to:
Temporary differences 148,523 (406,091) 142,291 (389,051)
Tax loss carried forward (88,794) (61,446) (85,068) (58,868)
Tax credit carried over (49,644) (20,023) (47,561) (19,183)
10,085 (487,560) 9,662 (467,101)
Income tax expense 857,014 658,198 $821,052 $630,579