Hyundai 2004 Annual Report Download - page 45
Download and view the complete annual report
Please find page 45 of the 2004 Hyundai annual report below. You can navigate through the pages in the report by either clicking on the pages listed below, or by using the keyword search tool below to find specific information within the annual report.-
 1
1 -
2
-
3
-
4
-
5
-
6
-
7
-
8
-
9
-
10
-
11
-
12
-
13
-
14
-
15
-
16
-
17
-
18
-
19
-
20
-
21
-
22
-
23
-
24
-
25
-
26
-
27
-
28
-
29
-
30
-
31
-
32
-
33
-
34
-
 35
35 -
 36
36 -
 37
37 -
 38
38 -
 39
39 -
 40
40 -
 41
41 -
 42
42 -
 43
43 -
 44
44 -
 45
45 -
 46
46 -
 47
47 -
 48
48 -
 49
49 -
 50
50 -
 51
51 -
 52
52 -
 53
53 -
 54
54 -
 55
55 -
56
-
57
-
58
-
59
-
60
-
61
-
62
-
63
-
64
-
65
 |
 |
Hyundai Motor Company Annual Report 2004_88
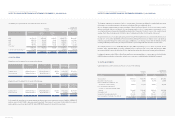
HYUNDAI MOTOR COMPANY AND SUBSIDIARIES
NOTES TO CONSOLIDATED FINANCIAL STATEMENTS DECEMBER 31, 2004 AND 2003
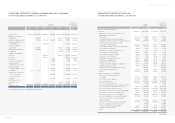
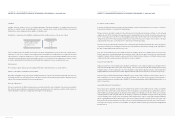
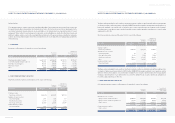
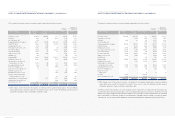
Equity securities stated at fair value included in long-term investment securities as of December 31, 2003 consist of the following:
Companies Acquisition Book value Book value Ownership
cost percentage (*2)
INI Steel (*1) 137,175 247,264 $236,888 23.81
Jin Heung Mutual Savings Bank 2,166 1,990 1,906 8.66
Korea Mutual Savings Bank 2,846 3,501 3,354 8.13
Saehan Media 4,933 3,284 3,146 6.52
Korea Information Service, Inc. 5,252 8,301 7,953 4.41
Daewoo Engineering & Construction Co., Ltd. 42,483 56,945 54,555 3.06
Hyundai Heavy Industries Co., Ltd. 56,924 82,125 78,679 2.88
Daewoo International Corporation 9,822 17,301 16,575 2.51
Hyundai Information Technology Co., Ltd. 10,000 1,260 1,207 2.21
Korea Industrial Development Co., Ltd. 5,058 3,279 3,141 2.20
ICOLS Inc. 160 272 261 1.78
LG Telecom, Ltd. 19,851 13,536 12,968 1.34
Hyundai Corporation 13,626 747 716 1.08
Chohung Bank 73,545 26,705 25,585 0.95
Hyundai Merchant Marine Co., Ltd. 7,329 5,565 5,332 0.55
Hyundai Engineering & Construction Co., Ltd. 13,332 3,053 2,925 0.53
Kanglim Co., Ltd. 347 48 46 0.38
KT Freetel 18,000 10,627 10,181 0.29
Prochips Technology Inc. 904 33 32 0.22
Kia Steel Co., Ltd. 955 779 746 0.19
Hynix Semiconductor Inc. 2,047 4,043 3,873 0.16
Treasury Stock Fund 4,067 1,498 1,435 -
Stock Market Stabilization Fund 6,010 20,414 19,558 -
Other 313 19 18 -
437,145 512,589 $491,080
(*1) Excluded in applying the equity method since a part of ownership is restricted to voting rights in accordance with the laws, and
the Company and subsidiaries believe there is no significant influence on the investees.
(*2) Ownership percentage is calculated by combining the ownership of the Company and its subsidiaries.
The differences between the acquisition cost and the book value stated at fair value in short-term investment securities and long-term
investment securities are recorded in capital adjustments (see Note 16). As of December 31, 2003, gain on valuation of
available-for-sale securities in capital adjustments of 361,630 million (US$346,455 thousand) consist of the difference that occurred
in the investment securities owned directly by the Company and the Company’s ownership portion of such difference that occurred in
the investment securities owned by its subsidiaries.
Korean won
(in millions)
Translation into
U. S. dollars (Note 2)
(in thousands)
(%)
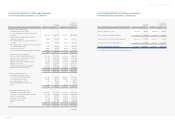
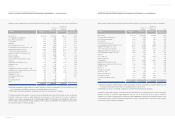
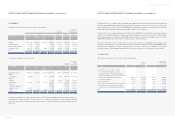
HYUNDAI MOTOR COMPANY AND SUBSIDIARIES
NOTES TO CONSOLIDATED FINANCIAL STATEMENTS DECEMBER 31, 2004 AND 2003
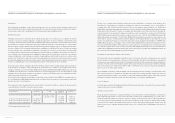
(2) Equity securities stated at fair value included in long-term investment securities as of December 31, 2004 consist of the following:
Companies Acquisition Book value Book value Ownership
cost percentage (*2)
INI Steel (*1) 137,175 317,911 $304,571 25.76
Jin Heung Mutual Savings Bank 2,166 1,308 1,253 8.66
Korea Mutual Savings Bank 2,846 3,325 3,186 8.13
Saehan Media 4,933 3,499 3,352 6.52
KOENTEC 1,550 5,409 5,182 6.20
Korea Information Service, Inc. 5,252 4,140 3,966 4.41
Daewoo Engineering & Construction Co., Ltd. 42,483 64,511 61,804 3.05
Hyundai Heavy Industries Co., Ltd. 56,924 75,446 72,280 2.88
Daewoo International Corporation 9,822 24,648 23,614 2.49
Hyundai Information Technology Co., Ltd. 10,000 1,217 1,166 2.21
LG Telecom, Ltd. 19,851 14,895 14,270 1.34
Hyundai Corporation 13,626 850 814 1.08
Doosan Industrial Development Co., Ltd. 2,186 2,093 2,005 0.95
ICOLS Inc. 80 70 67 0.51
Hyundai Merchant Marine Co., Ltd. 7,329 8,432 8,078 0.55
Kanglim Co., Ltd. 347 31 30 0.38
KT Freetel 18,000 13,742 13,165 0.30
Hyundai Engineering & Construction Co., Ltd. 13,332 4,581 4,389 0.27
SeAH Besteel Co., Ltd. (formerlly Kia Steel Co., Ltd.) 2,451 602 577 0.19
Hynix Semiconductor Inc. 2,047 8,411 8,058 0.16
Wigoglobal Co., Ltd. 904 5 5 0.12
Tong Yang Investment Bank 282 36 34 0.01
Aztech WB 152 60 57 -
Treasury Stock Fund 3,425 3,498 3,351 -
Other 67 82 79 -
357,230 558,802 $535,353
(*1) Excluded in applying the equity method since a part of ownership is restricted to voting rights in accordance with the laws, and
the Company and its subsidiaries believe there is no significant influence on the investees.
(*2) Ownership percentage is calculated by combining the ownership of the Company and its subsidiaries.
The differences between the acquisition cost and the book value stated at fair value in short-term investment securities and long-term
investment securities are recorded in capital adjustments (see Note 16). As of December 31, 2004, gain on valuation of
available-for-sale securities in capital adjustments of 490,869 million (US$470,271 thousand) consist of the difference that occurred
in the investment securities owned directly by the Company and the Company’s ownership portion of such difference that occurred in
the investment securities owned by its subsidiaries.
Korean won
(in millions)
Translation into
U. S. dollars (Note 2)
(in thousands)
(%)