Hyundai 2004 Annual Report Download - page 54
Download and view the complete annual report
Please find page 54 of the 2004 Hyundai annual report below. You can navigate through the pages in the report by either clicking on the pages listed below, or by using the keyword search tool below to find specific information within the annual report.-
 1
1 -
2
-
3
-
4
-
5
-
6
-
7
-
8
-
9
-
10
-
11
-
12
-
13
-
14
-
15
-
16
-
17
-
18
-
19
-
20
-
21
-
22
-
23
-
24
-
25
-
26
-
27
-
28
-
29
-
30
-
31
-
32
-
33
-
34
-
35
-
36
-
37
-
38
-
39
-
40
-
41
-
42
-
43
-
 44
44 -
 45
45 -
 46
46 -
 47
47 -
 48
48 -
 49
49 -
 50
50 -
 51
51 -
 52
52 -
 53
53 -
 54
54 -
 55
55 -
 56
56 -
 57
57 -
 58
58 -
 59
59 -
 60
60 -
 61
61 -
 62
62 -
 63
63 -
 64
64 -
65
 |
 |

Hyundai Motor Company Annual Report 2004_106
HYUNDAI MOTOR COMPANY AND SUBSIDIARIES
NOTES TO CONSOLIDATED FINANCIAL STATEMENTS DECEMBER 31, 2004 AND 2003
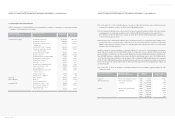
The Company calculates the total compensation expense using the option-pricing model. In the model, the risk-free rate of 4.94% and
9.04%, an expected exercise period of 5.5 years and an expected variation rate of stock price of 63.29 percent and 71.1 percent are
used for the options granted on February 14, 2003 and March 10, 2000, respectively. Total compensation expenses amounting to
15,141 million (US$14,506 thousand) and 11,832 million (US$11,336 thousand) for the options granted on February 14, 2003
and March 10, 2000, respectively, have been accounted for as a charge to current operations and a credit to stock option cost in
capital adjustments over the required period of service (two years) from the grant date using the straight-line method.
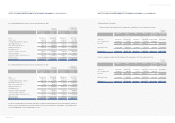
(4)Cumulative translation adjustments
Cumulative translation debits of 213,608 million (US$204,645 thousand) and 32,503 million (US$31,139 thousand) as of
December 31, 2004 and 2003, respectively, which result from the translation of financial statements of overseas subsidiaries and the
two branches located in the United States, are included in capital adjustments on the basis set forth in Note 2.
(5)Gain (loss) on valuation of derivatives
The gain (loss) on valuation of the effective portion of derivative instruments for cash flow hedging purpose from forecasted exports is
included in capital adjustments on the basis set forth in Note 2. The Company recorded a loss of 17,051 million (US$16,335
thousand) and 83,863 million (US$80,344 thousand) as of December 31, 2004 and 2003, respectively.
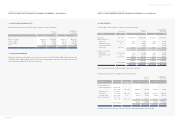
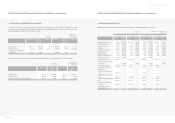
17. PLEDGED ASSETS, CHECKS AND NOTES:
As of December 31, 2004, the following assets, checks and notes are pledged as collateral:
(1) The Company’s and its domestic subsidiaries' property, plant and equipment are pledged as collateral for various loans to a
maximum of 3,216 billion (US$3,081 million).
(2) The Company’s and its domestic subsidiaries’ cash and cash equivalents of 10,258 million (US$9,828 thousand), financial
instruments of 136,969 million (US$131,221 thousand), some investment securities, including 1,593,466 shares of KIA,
2,640,000 shares of Eukor Car Carriers Inc. and others, are pledged as collateral for various borrowings, debentures, payables,
lease agreements, guarantees of a customer financing system and others.
(3) Certain overseas subsidiaries’ receivables, inventories and other financial business assets are pledged as collateral for their
borrowings.
(4) 104 blank checks, 197 blank promissory notes, 2 checks amounting to 2,624 million (US$2,514 thousand) and 3 promissory
notes amounting to 21,562 million (US$20,657 thousand) are pledged as collateral to financial institutions and others.
HYUNDAI MOTOR COMPANY AND SUBSIDIARIES
NOTES TO CONSOLIDATED FINANCIAL STATEMENTS DECEMBER 31, 2004 AND 2003
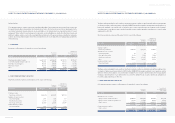
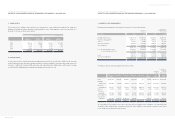
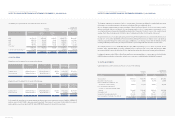
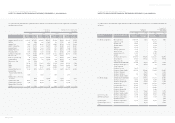
(1)Treasury stock
For the stabilization of stock price, the Company has treasury stock consisting of 820,910 common shares and 3,138,600 preferred
shares with a carrying value of 90,348 million (US$86,557 thousand) as of December 31, 2004 and 889,470 common shares and
3,138,600 preferred shares with a carrying value of 89,706 million (US$85,942 thousand) as of December 31, 2003, respectively,
acquired directly or indirectly through the Treasury Stock Fund and Trust Cash Fund. In addition, the Company’s ownership portion
of subsidiaries’ treasury stock held by themselves, amounting to 7,993 million (US$7,658 thousand) and 3,485 million
(US$3,339 thousand) as of December 31, 2004 and 2003, respectively, are included in the treasury stock.
(2) Discounts on stock issuance
Certain subsidiaries accounted for expense on issuance of new stock as discounts on stock issuance. The Company’s ownership
portion of these discounts amounting to 3,244 million (US$3,108 thousand) and 3,015 million (US$2,888 thousand) is
accounted for as a debit to capital adjustments as of December 31, 2004 and 2003, respectively.
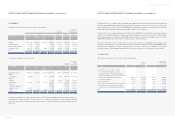
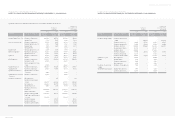
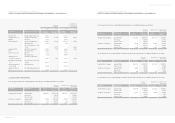
(3) Stock option cost
The Company granted directors stock options at an exercise price of 26,800 (grant date: February 14, 2003, beginning date for
exercise: February 14, 2006, expiry date for exercise: February 13, 2011) and 14,900 (grant date: March 10, 2000, beginning date
for exercise: March 10, 2003, expiry date for exercise: March 9, 2008). These stock options all require at least two-year continued
service starting from the grant date. If all of the stock options as of December 31, 2004 are exercised, 1,752,400 shares (1,322,000
shares and 430,400 shares for the options granted on February 14, 2003 and March 10, 2000, respectively) will be issued as new
shares or using treasury stock or will be compensated by cash, according to the decision of the Board of Directors. In 2004 and 2003,
429,800 shares of stock options granted as of March 10, 2000 were exercised by directors, respectively (see Note 15).