Hyundai 2004 Annual Report Download - page 46
Download and view the complete annual report
Please find page 46 of the 2004 Hyundai annual report below. You can navigate through the pages in the report by either clicking on the pages listed below, or by using the keyword search tool below to find specific information within the annual report.-
 1
1 -
2
-
3
-
4
-
5
-
6
-
7
-
8
-
9
-
10
-
11
-
12
-
13
-
14
-
15
-
16
-
17
-
18
-
19
-
20
-
21
-
22
-
23
-
24
-
25
-
26
-
27
-
28
-
29
-
30
-
31
-
32
-
33
-
34
-
35
-
 36
36 -
 37
37 -
 38
38 -
 39
39 -
 40
40 -
 41
41 -
 42
42 -
 43
43 -
 44
44 -
 45
45 -
 46
46 -
 47
47 -
 48
48 -
 49
49 -
 50
50 -
 51
51 -
 52
52 -
 53
53 -
 54
54 -
 55
55 -
 56
56 -
57
-
58
-
59
-
60
-
61
-
62
-
63
-
64
-
65
 |
 |
Hyundai Motor Company Annual Report 2004_90
HYUNDAI MOTOR COMPANY AND SUBSIDIARIES
NOTES TO CONSOLIDATED FINANCIAL STATEMENTS DECEMBER 31, 2004 AND 2003
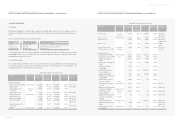
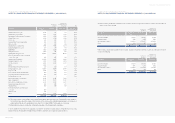
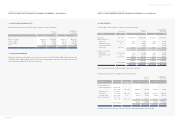
ROTIS 1,000 8 8 1.33
Koryo Co., Ltd. 6,625 728 697 1.02
Korea Software Financial Cooperative 500 500 479 0.60
Cheju International Convention Center 500 500 479 0.59
Korea Economy Daily 168 168 161 0.22
Daewoo Motor Co., Ltd. 2,213 - - 0.02
Pilot beneficiary certificates 10,786 10,786 10,333 -
Machinery Insurance Cooperative 10,501 10,501 10,060 -
Badbank Harmony Co., Ltd. 13,905 - - -
Korea Defense Industry Association 4,890 4,890 4,685 -
Other 5,530 3,011 2,885 -
251,013 192,608 $184,526
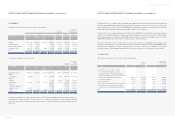
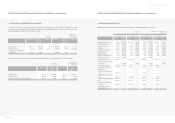
(*1) The equity securities of these affiliates were excluded from using the equity method since the Company believes the changes in
the investment value due to the changes in the net assets of the investee, whose individual beginning balance of total assets or
paid-in capital at the date of its establishment is less than 7,000 million (US$6,706 thousand), are not material.
(*2) This investment security was excluded from using the equity method despite its ownership percentage exceeding twenty
percentages, since there is no significant influence on the investee.
(*3) Ownership percentage is calculated by combining the ownership of the Company and its subsidiaries.
In 2004, impairment loss between the acquisition cost and the estimated recoverable amount of Hyundai Information Technology Co.,
Ltd., Hyundai Corporation, Hyundai Asan Corporation, Space Imaging LLC, Badbank Harmony Co., Ltd. and others are recognized in
current operations.
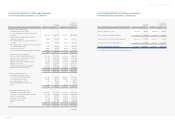
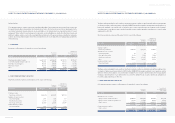
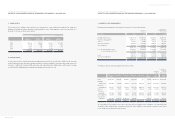
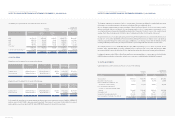
Equity securities stated at acquisition cost included in long-term investment securities as of December 31, 2003 consist of the
following:
Companies Acquisition Book value Book value Ownership
cost percentage (*3)
Korean won
(in millions)
Translation into
U. S. dollars (Note 2)
(in thousands)
(%)
Hyundai Jingxian Motor Safeguard Service
Co., Ltd. (*1) 2,019 2,019 $1,934 84.87
NGVTEK.com (*1) 571 571 547 53.66
Amco Corp. 950 950 910 19.99
Dongyong Industries Co., Ltd. 241 241 231 19.35
Jinil MVC Co., Ltd. 180 180 172 18.00
Mobil.Com Co., Ltd. 1,800 1,800 1,724 17.39
Industri Otomotif Komersial 4,439 4,439 4,253 15.00
Hyundai Technology Investment Co., Ltd. 4,490 4,490 4,302 14.97
Companies Acquisition Book value Book value Ownership
cost percentage (*2)
Korean won
(in millions)
Translation into
U. S. dollars (Note 2)
(in thousands)
(%)
HYUNDAI MOTOR COMPANY AND SUBSIDIARIES
NOTES TO CONSOLIDATED FINANCIAL STATEMENTS DECEMBER 31, 2004 AND 2003
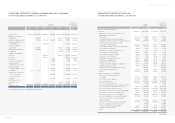
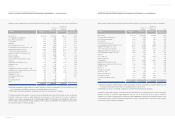
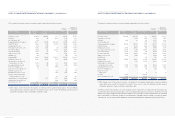
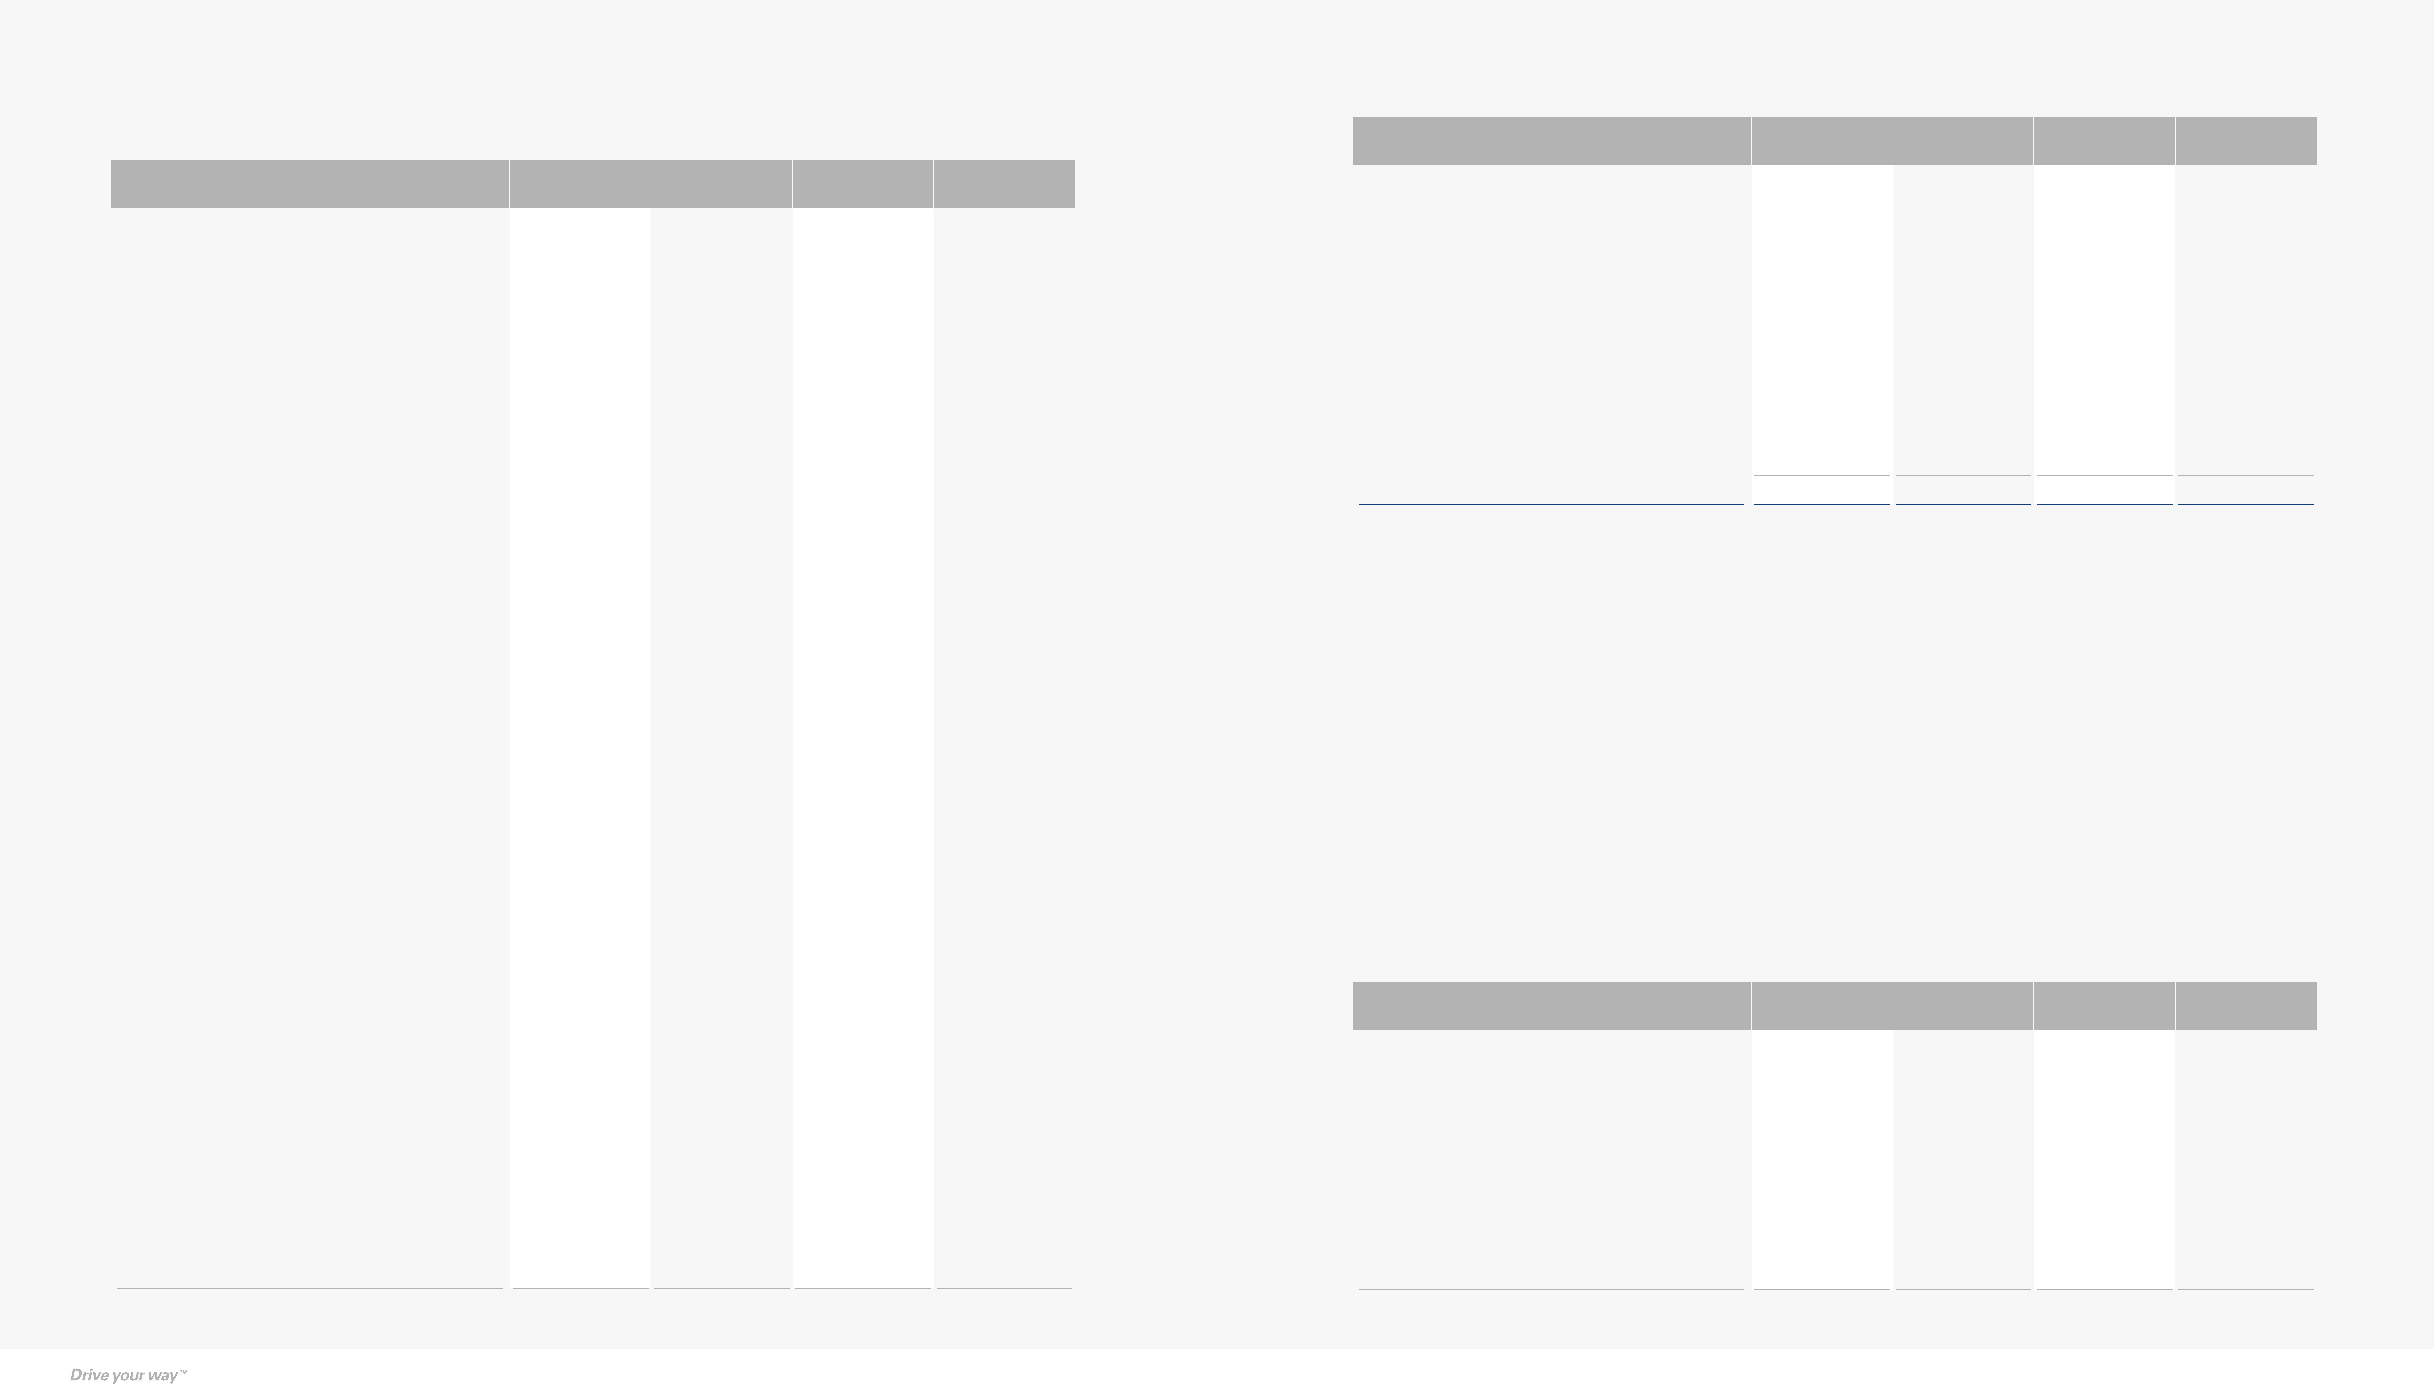
(3) Equity securities stated at acquisition cost included in long-term investment securities as of December 31, 2004 consist of the
following:
Companies Acquisition Book value Book value Ownership
cost percentage (*3)
Hyundai Motor Norway AS 2,123 2,123 $2,034 100.00
Hyundai Motor Hungary 721 721 691 100.00
Hyundai Jingxian Motor Safeguard
Service Co., Ltd. (*1) 4,907 4,907 4,701 91.75
NGVTEK.com (*1) 571 571 547 53.66
Hyundai-Motor Group China Ltd. 2,534 2,534 2,428 50.00
Seoul Metro 9th line (*2) 2,153 2,153 2,063 29.40
Michigan Global Culture Investment 1,000 1,000 958 20.00
Amco Corp. 1,024 1,024 981 19.99
Heesung PM Tech Corporation 1,194 1,194 1,144 19.90
Dongyong Industries Co., Ltd. 241 241 231 19.23
Hyundai RB Co. 550 550 527 18.64
Jinil MVC Co., Ltd. 180 180 172 18.00
Mobil.Com Co., Ltd. 1,800 1,800 1,724 17.39
Clean Air Technology Inc. 500 500 479 16.13
Industri Otomotif Komersial 4,439 4,439 4,253 15.00
Hyundai Technology Investment Co., Ltd. 4,490 4,490 4,302 14.97
Hyundai Unicorns Co., Ltd. 5,795 137 131 14.90
Hyundai Research Institute 1,359 1,271 1,218 14.90
Mando Map & Soft Co., Ltd. 778 778 745 14.00
Gyeongnam Credit Guarantee Foundation 2,500 2,500 2,395 13.66
Kihyup Finance, Inc. 3,700 3,700 3,545 12.75
Micro Infinity 607 607 581 10.50
Yonhap Capital Co., Ltd. 10,500 10,500 10,059 10.49
3Gcore, Inc. 225 225 216 10.43
Toba Telecom 405 - - 10.02
Wisco Co., Ltd. 349 349 334 9.68
Hyundai Finance Corporation 9,888 9,888 9,473 9.29
Daejoo Heavy Industry Co. Ltd. 650 650 623 9.29
Namyang Industrial Co., Ltd. 200 200 192 8.00
Hankyoreh Plus Inc. 4,800 284 272 7.41
Hyundai Oil Refinery Co., Ltd. 88,857 88,857 85,128 7.24
Korea Credit-card Electronic-settlement
Service Co., Ltd. 484 254 243 6.72
Korea Smart Card Co., Ltd. 1,628 1,628 1,560 5.00
Hyundai Asan Corporation 22,500 5,405 5,178 4.61
U.S. Electrical Inc. 2,204 2,204 2,112 3.80
Space Imaging LLC 5,319 432 414 2.16
Dongwon Capital Co., Ltd. 3,000 3,000 2,874 1.77
KIS Information & Communication, Inc. 220 220 211 1.67
Korean won
(in millions)
Translation into
U. S. dollars (Note 2)
(in thousands)
(%)