Hyundai 2004 Annual Report Download - page 33
Download and view the complete annual report
Please find page 33 of the 2004 Hyundai annual report below. You can navigate through the pages in the report by either clicking on the pages listed below, or by using the keyword search tool below to find specific information within the annual report.-
 1
1 -
2
-
3
-
4
-
5
-
6
-
7
-
8
-
9
-
10
-
11
-
12
-
13
-
14
-
15
-
16
-
17
-
18
-
19
-
20
-
21
-
22
-
 23
23 -
 24
24 -
 25
25 -
 26
26 -
 27
27 -
 28
28 -
 29
29 -
 30
30 -
 31
31 -
 32
32 -
 33
33 -
 34
34 -
 35
35 -
 36
36 -
 37
37 -
 38
38 -
 39
39 -
 40
40 -
 41
41 -
 42
42 -
 43
43 -
44
-
45
-
46
-
47
-
48
-
49
-
50
-
51
-
52
-
53
-
54
-
55
-
56
-
57
-
58
-
59
-
60
-
61
-
62
-
63
-
64
-
65
 |
 |

Hyundai Motor Company Annual Report 2004_64
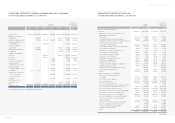
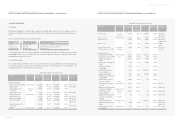
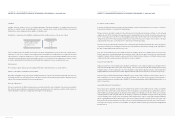
HYUNDAI MOTOR COMPANY AND SUBSIDIARIES
CONSOLIDATED BALANCE SHEETS (CONTINUED) AS OF DECEMBER 31, 2004 AND 2003
Korean won
(in millions)
Translation into
U. S. dollars (Note 2)
(in thousands)
LIABILITIES AND SHAREHOLDERS’ EQUITY 2004 2003 2004 2003
Current liabilities:
Short-term borrowings (Note 13) 10,571,772 9,457,854 $10,128,159 $9,060,983
Current maturities of long-term debt, net of
Unamortized discount of 3,002 million in
2004 and 5,163 million in 2003 (Note 14) 3,998,768 5,653,180 3,830,971 5,415,961
Trade notes and accounts payable 6,374,259 4,230,095 6,106,782 4,052,591
Accrued warranties and product liabilities 1,395,228 1,220,380 1,336,681 1,169,170
Accounts payable-other 2,318,211 2,356,840 2,220,934 2,257,942
Accrued expenses 726,357 858,883 695,878 822,842
Income tax payable 596,285 725,739 571,264 695,285
Other current liabilities 740,777 815,259 709,693 781,049
Total current liabilities 26,721,657 25,318,230 25,600,362 24,255,823
Long-term liabilities:
Long-term debt, net of current maturities
(Note 14) 7,683,741 6,432,270 7,361,315 6,162,359
Accrued severance benefits, net of National
Pension payments for employees of 80,850
million in 2004 and 104,223 million in
2003, and individual severance insurance
deposits of 1,711,181 million in 2004 and
1,641,600 million in 2003 (Note 2) 1,005,201 1,031,582 963,021 988,295
Accrued loss on valuation of derivatives (Note 2) 24,693 209,285 23,657 200,503
Accrued warranties and product liabilities 3,594,569 3,391,690 3,443,733 3,249,368
Deferred income tax liabilities (Note 19) 1,036,499 911,537 993,005 873,287
Other long-term liabilities 1,061,524 703,381 1,016,981 673,866
Total long-term liabilities 14,406,227 12,679,745 13,801,712 12,147,678
Other financial business liabilities 108,843 - 104,276 -
Total liabilities 41,236,727 37,997,975 $39,506,350 $36,403,501
Commitments and contingencies (Note 24)
(continued)
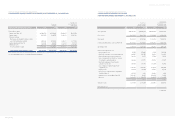
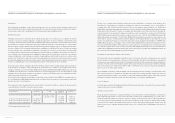
HYUNDAI MOTOR COMPANY AND SUBSIDIARIES
CONSOLIDATED BALANCE SHEETS AS OF DECEMBER 31, 2004 AND 2003
ASSETS 2004 2003 2004 2003
Current assets:
Cash and cash equivalents (Note 17) 3,187,954 4,763,452 $3,054,181 $4,563,568
Short-term financial instruments (Note 17) 5,540,454 4,054,421 5,307,965 3,884,289
Short-term investment securities (Note 4) 471,218 393,798 451,445 377,273
Trade notes and accounts receivable, less
allowance for doubtful accounts of 258,146
million in 2004 and 284,470 million in 2003,
and unamortized present value discount of
1,269 million in 2004 and 1,201 million
in 2003 2,755,645 2,703,821 2, 640,012 2,590,363
Inventories (Note 3) 6,940,542 5,498,529 6,649,303 5,267,799
Advances and other, net of allowance for
doubtful accounts of 98,855 million in 2004
and 177,355 million in 2003, and unamortized
present value discount of nil in 2004 and
5,735 million in 2003 2,654,980 1,918,753 2,543,572 1,838,239
Total current assets 21,550,793 19,332,774 20,646,478 18,521,531
Non-current assets:
Long-term financial instruments (Note 17) 135,385 208,300 129,704 199,559
Long-term investment securities (Notes 5 and 17) 2,884,751 2,471,155 2,763,701 2,367,460
Investment securities accounted for using
the equity method (Notes 6 and 17) 1,119,085 830,231 1,072,126 795,393
Property, plant and equipment, net of
accumulated depreciation and accumulated
impairment loss of 8,523,304 million
in 2004 and 7,445,356 million in 2003
(Notes 7, 8, 9 and 17) 19,802,286 17,842,898 18,971,341 17,094,173
Intangibles (Note 10) 1,812,495 1,862,057 1,736,439 1,783,921
Other assets (Notes 11 and 17) 1,079,972 1,083,349 1,034,654 1,037,890
Deferred income tax assets (Note 19) 2,357,859 2,509,050 2,258,918 2,403,765
Total non-current assets 29,191,833 26,807,040 27,966,883 25,682,161
Other financial business assets (Note 12) 7,623,936 7,287,008 7,304,020 6,981,230
Total assets 58,366,562 53,426,822 $55,917,381 $51,184,922
(continued)
Korean won
(in millions)
Translation into
U. S. dollars (Note 2)
(in thousands)