Hyundai 2004 Annual Report Download - page 36
Download and view the complete annual report
Please find page 36 of the 2004 Hyundai annual report below. You can navigate through the pages in the report by either clicking on the pages listed below, or by using the keyword search tool below to find specific information within the annual report.-
 1
1 -
2
-
3
-
4
-
5
-
6
-
7
-
8
-
9
-
10
-
11
-
12
-
13
-
14
-
15
-
16
-
17
-
18
-
19
-
20
-
21
-
22
-
23
-
24
-
25
-
 26
26 -
 27
27 -
 28
28 -
 29
29 -
 30
30 -
 31
31 -
 32
32 -
 33
33 -
 34
34 -
 35
35 -
 36
36 -
 37
37 -
 38
38 -
 39
39 -
 40
40 -
 41
41 -
 42
42 -
 43
43 -
 44
44 -
 45
45 -
 46
46 -
47
-
48
-
49
-
50
-
51
-
52
-
53
-
54
-
55
-
56
-
57
-
58
-
59
-
60
-
61
-
62
-
63
-
64
-
65
 |
 |
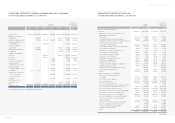
Hyundai Motor Company Annual Report 2004_70
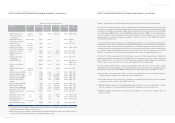
HYUNDAI MOTOR COMPANY AND SUBSIDIARIES
CONSOLIDATED STATEMENTS OF CASH FLOWS
FOR THE YEARS ENDED DECEMBER 31, 2004 AND 2003
2004 2003 2004 2003
Cash flows from operating activities:
Net income 1,686,831 1,792,655 $1,616,048 $1,717,432
Adjustments to reconcile net income to net cash
provided by operating activities:
Depreciation 1,622,192 1,437,823 1,554,121 1,377,489
Loss (gain) on foreign currency translation, net (201,308) 65,305 (192,861) 62,565
Loss (gain) on disposal of investments and other assets, net
15,990 (118,791) 15,319 (113,806)
Gain on valuation of investments accounted
for using the equity method, net (284,264) (219,571) (272,336) (210,357)
Loss on disposal of property, plant and equipment, net 137,193 269,723 131,436 258,405
Loss on valuation of inventories 23,795 15,002 22,797 14,372
Loss (gain) on redemption of debentures, net (3,144) 115 (3,012) 110
Loss on impairment of investments 232,476 45,617 222,721 43,703
Loss on disposal of trade receivables 114,365 77,926 109,566 74,656
Impairment loss on intangibles 472,906 3,232 453,062 3,096
Amortization of discount on debentures 38,294 41,193 36,687 39,464
Amortization of intangibles, net 387,433 488,954 371,176 468,436
Provision for severance benefits 558,188 591,737 534,765 566,906
Provision for warranties and product liability, net 872,706 1,463,308 836,085 1,401,905
Provision for doubtful accounts 934,865 1,533,664 895,636 1,469,308
Amortization of present value discount accounts - (107,948) - (103,418)
Net income on minority interests 176,103 268,605 168,713 257,334
Others (55,416) (20,757) (53,091) (19,884)
Changes in operating assets and liabilities:
Decrease in trade notes and accounts
receivable 129,784 2,104,701 124,338 2,016,383
Decrease (increase) in advances (51,189) 136,828 (49,041) 131,086
Increase in inventories (1,341,159) (1,412,848) (1,284,881) (1,353,562)
Increase in other current assets (537,866) (94,041) (515,296) (90,094)
Decrease in long-term notes and accounts receivables - 4,346 - 4,164
Decrease (increase) in deferred income tax assets 102,091 (1,152,582) 97,807 (1,104,217)
Increase in other financial business assets (1,329,469) (1,666,097) (1,273,682) (1,596,185)
Increase (decrease) in trade notes and accounts payable 815,166 (464,741) 780,960 (445,240)
Increase (decrease) in accounts payable-other 200,316 (385,383) 191,910 (369,212)
Increase (decrease) in other current liabilities (298,882) 487,079 (286,340) 466,641
Increase in individual severance insurance deposits (69,580) (19,526) (66,660) (18,707)
Increase (decrease) in accrued warranties and
product liabilities 163,314 (129,315) 156,461 (123,889)
Decrease in accrued loss on valuation of derivatives (152,035) (961) (145,655) (921)
Increase in cumulative translation debits, net - (70,830) - (67,858)
Increase in deferred income tax liabilities 124,962 786,795 119,718 753,779
Payment of severance benefits (538,361) (406,840) (515,770) (389,768)
Others 67,495 (83,717) 64,664 (80,203)
4,013,792 5,260,660 3,845,365 5,039,912
(continued)
Korean won
(in millions)
Translation into
U. S. dollars (Note 2)
(in thousands)
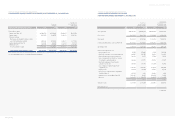
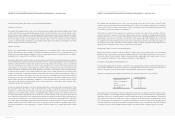
HYUNDAI MOTOR COMPANY AND SUBSIDIARIES
CONSOLIDATED STATEMENTS OF CHANGES IN SHAREHOLDERS’ EQUITY (CONTINUED)
FOR THE YEARS ENDED DECEMBER 31, 2004 AND 2003
Korean won
(in millions)
Translation into
U.S. dollars (Note 2)
(in thousands)
Capital Capital Retained Capital Minority Total Total
stock surplus earnings adjustments interests amount amount
January 1, 2004 1,478,603 5,328,775 5,188,818 (28,357) 3,461,008 15,428,847 $14,781,421
Additional investment in
subsidiaries - (84,296) - - (42,096) (126,392) (121,088)
Disposal of subsidiaries’ stock 95,489 (13,041) (78,622) 241,929 245,755 235,443
Extinguishment of treasury
stock by surplus - - (65,092) - - (65,092) (62,361)
Increase in subsidiaries’
capital-stock - (60,965) - - 287,517 226,552 217,045
Merger between subsidiaries - (32,409) - - (506) (32,915) (31,534)
Consolidation ----14,942 14,942 14,315
Payment of cash dividends
(Note 20) - - (285,674) - (70,096) (355,770) (340,841)
Net income - - 1,686,831 - - 1,686,831 1,616,048
Treasury stock - - - (5,280) - (5,280) (5,058)
Discount on stock issuance - - - (230) - (230) (220)
Gain on valuation of
available-for-sale securities - - - 141,089 - 141,089 135,169
Gain on valuation of
investment equity securities - - - (53,678) - (53,678) (51,426)
Stock options 2,149 8,197 - 2,512 - 12,858 12,318
Cumulative effect of foreign
currency translation - - - (180,962) - (180,962) (173,368)
Loss on transaction of
derivatives - - - 64,463 - 64,463 61,758
Effect of change in the
minority interests ----176,103 176,103 168,713
Others - (92,916) 18,402 - 27,228 (47,286) (45,303)
December 31, 2004
1,480,752
5,161,875
6,530,244
(139,065)
4,096,029
17,129,835 $16,411,031
See accompanying notes to consolidated financial statements.