Holiday Inn 2010 Annual Report Download - page 96
Download and view the complete annual report
Please find page 96 of the 2010 Holiday Inn annual report below. You can navigate through the pages in the report by either clicking on the pages listed below, or by using the keyword search tool below to find specific information within the annual report.-
 1
1 -
2
-
3
-
4
-
5
-
6
-
7
-
8
-
9
-
10
-
11
-
12
-
13
-
14
-
15
-
16
-
17
-
18
-
19
-
20
-
21
-
22
-
23
-
24
-
25
-
26
-
27
-
28
-
29
-
30
-
31
-
32
-
33
-
34
-
35
-
36
-
37
-
38
-
39
-
40
-
41
-
42
-
43
-
44
-
45
-
46
-
47
-
48
-
49
-
50
-
51
-
52
-
53
-
54
-
55
-
56
-
57
-
58
-
59
-
60
-
61
-
62
-
63
-
64
-
65
-
66
-
67
-
68
-
69
-
70
-
71
-
72
-
73
-
74
-
75
-
76
-
77
-
78
-
79
-
80
-
81
-
82
-
83
-
84
-
85
-
 86
86 -
 87
87 -
 88
88 -
 89
89 -
 90
90 -
 91
91 -
 92
92 -
 93
93 -
 94
94 -
 95
95 -
 96
96 -
 97
97 -
 98
98 -
 99
99 -
 100
100 -
 101
101 -
 102
102 -
 103
103 -
 104
104 -
 105
105 -
 106
106 -
107
-
108
-
109
-
110
-
111
-
112
-
113
-
114
-
115
-
116
-
117
-
118
-
119
-
120
-
121
-
122
-
123
-
124
 |
 |

94 IHG Annual Report and Financial Statements 2010
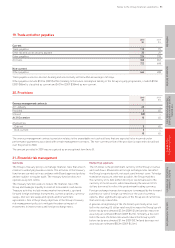
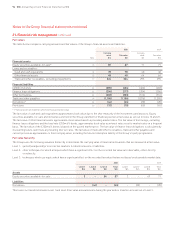
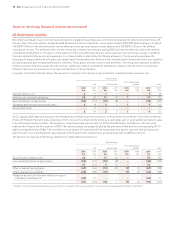
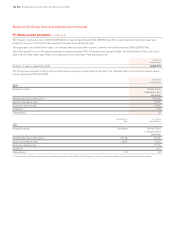
21. Financial risk management continued
Fair values
The table below compares carrying amounts and fair values of the Group’s financial assets and liabilities.
2010 2009
Carrying Carrying
value Fair value value Fair value
Note $m $m $m $m
Financial assets
Equity securities available-for-sale* 15 87 87 71 71
Loans and receivables:
Cash and cash equivalents 18 78 78 40 40
Other financial assets 15 48 48 64 64
Trade and other receivables, excluding prepayments 17 324 324 295 295
Financial liabilities
£250m 6% bonds 22 (385) (404) (402) (402)
Finance lease obligations 22 (206) (217) (204) (206)
Other borrowings 22 (203) (203) (516) (516)
Trade and other payables 19 (1,186) (1,186) (1,076) (1,076)
Derivatives* 23 (44) (44) (20) (20)
Provisions 20 (10) (10) (65) (65)
* Financial assets and liabilities which are measured at fair value.
The fair value of cash and cash equivalents approximates book value due to the short maturity of the investments and deposits. Equity
securities available-for-sale and derivatives are held in the Group statement of financial position at fair value as set out in notes 15 and 23.
The fair value of other financial assets approximates book value based on prevailing market rates. The fair value of borrowings, excluding
finance lease obligations and the fixed rate £250m 6% bonds, approximates book value as interest rates reset to market rates on a frequent
basis. The fair value of the £250m 6% bonds is based on the quoted market price. The fair value of finance lease obligations is calculated by
discounting future cash flows at prevailing interest rates. The fair value of trade and other receivables, trade and other payables and
current provisions approximates to their carrying value, including the future redemption liability of the Group’s loyalty programme.
Fair value hierarchy
The Group uses the following valuation hierarchy to determine the carrying value of financial instruments that are measured at fair value:
Level 1: quoted (unadjusted) prices in active markets for identical assets or liabilities.
Level 2: other techniques for which all inputs which have a significant effect on the recorded fair value are observable, either directly
or indirectly.
Level 3: techniques which use inputs which have a significant effect on the recorded fair value that are not based on observable market data.
2010 2009
Level 1 Level 2 Level 3 Total Level 1 Level 2 Level 3 Total
$m $m $m $m $m $m $m $m
Assets
Equity securities available-for-sale 3 – 84 87 2 – 69 71
Liabilities
Derivatives – (44) – (44) – (20) – (20)
There were no transfers between Level 1 and Level 2 fair value measurements during the year and no transfers into and out of Level 3.
Notes to the Group financial statements continued