Holiday Inn 2010 Annual Report Download - page 78
Download and view the complete annual report
Please find page 78 of the 2010 Holiday Inn annual report below. You can navigate through the pages in the report by either clicking on the pages listed below, or by using the keyword search tool below to find specific information within the annual report.-
 1
1 -
2
-
3
-
4
-
5
-
6
-
7
-
8
-
9
-
10
-
11
-
12
-
13
-
14
-
15
-
16
-
17
-
18
-
19
-
20
-
21
-
22
-
23
-
24
-
25
-
26
-
27
-
28
-
29
-
30
-
31
-
32
-
33
-
34
-
35
-
36
-
37
-
38
-
39
-
40
-
41
-
42
-
43
-
44
-
45
-
46
-
47
-
48
-
49
-
50
-
51
-
52
-
53
-
54
-
55
-
56
-
57
-
58
-
59
-
60
-
61
-
62
-
63
-
64
-
65
-
66
-
67
-
 68
68 -
 69
69 -
 70
70 -
 71
71 -
 72
72 -
 73
73 -
 74
74 -
 75
75 -
 76
76 -
 77
77 -
 78
78 -
 79
79 -
 80
80 -
 81
81 -
 82
82 -
 83
83 -
 84
84 -
 85
85 -
 86
86 -
 87
87 -
 88
88 -
89
-
90
-
91
-
92
-
93
-
94
-
95
-
96
-
97
-
98
-
99
-
100
-
101
-
102
-
103
-
104
-
105
-
106
-
107
-
108
-
109
-
110
-
111
-
112
-
113
-
114
-
115
-
116
-
117
-
118
-
119
-
120
-
121
-
122
-
123
-
124
 |
 |

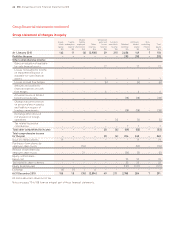
76 IHG Annual Report and Financial Statements 2010
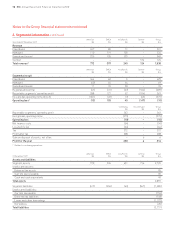
Americas EMEA Asia Pacific Central Group
Year ended 31 December 2010 $m $m $m $m $m
Revenue
Franchised 465 81 12 – 558
Managed 119 130 155 – 404
Owned and leased 223 203 136 – 562
Central – – – 104 104
Total revenue* 807 414 303 104 1,628
Americas EMEA Asia Pacific Central Group
$m $m $m $m $m
Segmental result
Franchised 392 59 7 – 458
Managed 21 62 73 – 156
Owned and leased 13 40 35 – 88
Regional and central (57) (36) (26) (139) (258)
Reportable segments’ operating profit 369 125 89 (139) 444
Exceptional operating items (note 5) 14 3 (2) – 15
Operating profit* 383 128 87 (139) 459
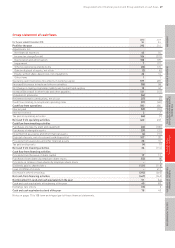
Continuing Discontinued Group
$m $m $m
Reportable segments’ operating profit 444 – 444
Exceptional operating items 15 – 15
Operating profit 459 – 459
Net finance costs (62) – (62)
Profit before tax 397 – 397
Tax (106) – (106)
Profit after tax 291 – 291
Gain on disposal of assets, net of tax – 2 2
Profit for the year 291 2 293
* Relates to continuing operations.
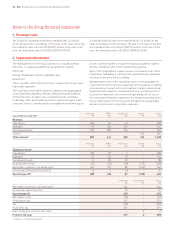
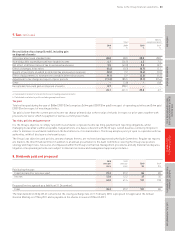
1. Exchange rates
The results of operations have been translated into US dollars
at the average rates of exchange for the year. In the case of sterling,
the translation rate is $1=£0.65 (2009 $1=£0.64). In the case of the
euro, the translation rate is $1=€0.76 (2009 $1=€0.72).
Assets and liabilities have been translated into US dollars at the
rates of exchange on the last day of the year. In the case of sterling,
the translation rate is $1=£0.64 (2009 $1=£0.62). In the case of the
euro, the translation rate is $1=€0.75 (2009 $1=€0.69).
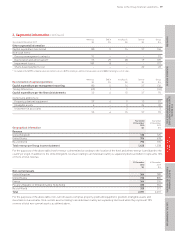
2. Segmental information
The management of the Group’s operations, excluding Central
functions, is organised within three geographical regions:
Americas;
Europe, Middle East and Africa (EMEA); and
Asia Pacific.
These, together with Central functions, comprise the Group’s four
reportable segments.
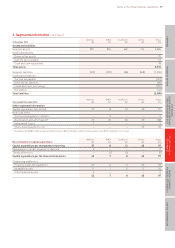
The Asia Pacific reportable segment comprises the aggregation
of two operating segments, Greater China and Asia Australasia.
Central functions include costs of global functions, including
technology, sales and marketing, finance, human resources and
corporate services; revenue arises principally from technology fee
income. Central liabilities include the loyalty programme liability
and the cumulative short-term System Fund surplus.
Each of the geographical regions derives its revenues from either
franchising, managing or owning hotels and additional segmental
disclosures are provided accordingly.
Management monitors the operating results of the geographical
regions and Central functions separately for the purpose of making
decisions about resource allocation and performance assessment.
Segmental performance is evaluated based on operating profit or
loss and is measured consistently with operating profit or loss in
the consolidated financial statements, excluding exceptional items.
Group financing and income taxes are managed on a group basis
and are not allocated to reportable segments.
Notes to the Group financial statements