Holiday Inn 2010 Annual Report Download - page 56
Download and view the complete annual report
Please find page 56 of the 2010 Holiday Inn annual report below. You can navigate through the pages in the report by either clicking on the pages listed below, or by using the keyword search tool below to find specific information within the annual report.-
 1
1 -
2
-
3
-
4
-
5
-
6
-
7
-
8
-
9
-
10
-
11
-
12
-
13
-
14
-
15
-
16
-
17
-
18
-
19
-
20
-
21
-
22
-
23
-
24
-
25
-
26
-
27
-
28
-
29
-
30
-
31
-
32
-
33
-
34
-
35
-
36
-
37
-
38
-
39
-
40
-
41
-
42
-
43
-
44
-
45
-
 46
46 -
 47
47 -
 48
48 -
 49
49 -
 50
50 -
 51
51 -
 52
52 -
 53
53 -
 54
54 -
 55
55 -
 56
56 -
 57
57 -
 58
58 -
 59
59 -
 60
60 -
 61
61 -
 62
62 -
 63
63 -
 64
64 -
 65
65 -
 66
66 -
67
-
68
-
69
-
70
-
71
-
72
-
73
-
74
-
75
-
76
-
77
-
78
-
79
-
80
-
81
-
82
-
83
-
84
-
85
-
86
-
87
-
88
-
89
-
90
-
91
-
92
-
93
-
94
-
95
-
96
-
97
-
98
-
99
-
100
-
101
-
102
-
103
-
104
-
105
-
106
-
107
-
108
-
109
-
110
-
111
-
112
-
113
-
114
-
115
-
116
-
117
-
118
-
119
-
120
-
121
-
122
-
123
-
124
 |
 |
54 IHG Annual Report and Financial Statements 2010
Remuneration report continued
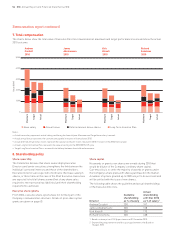
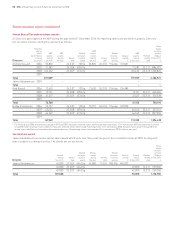
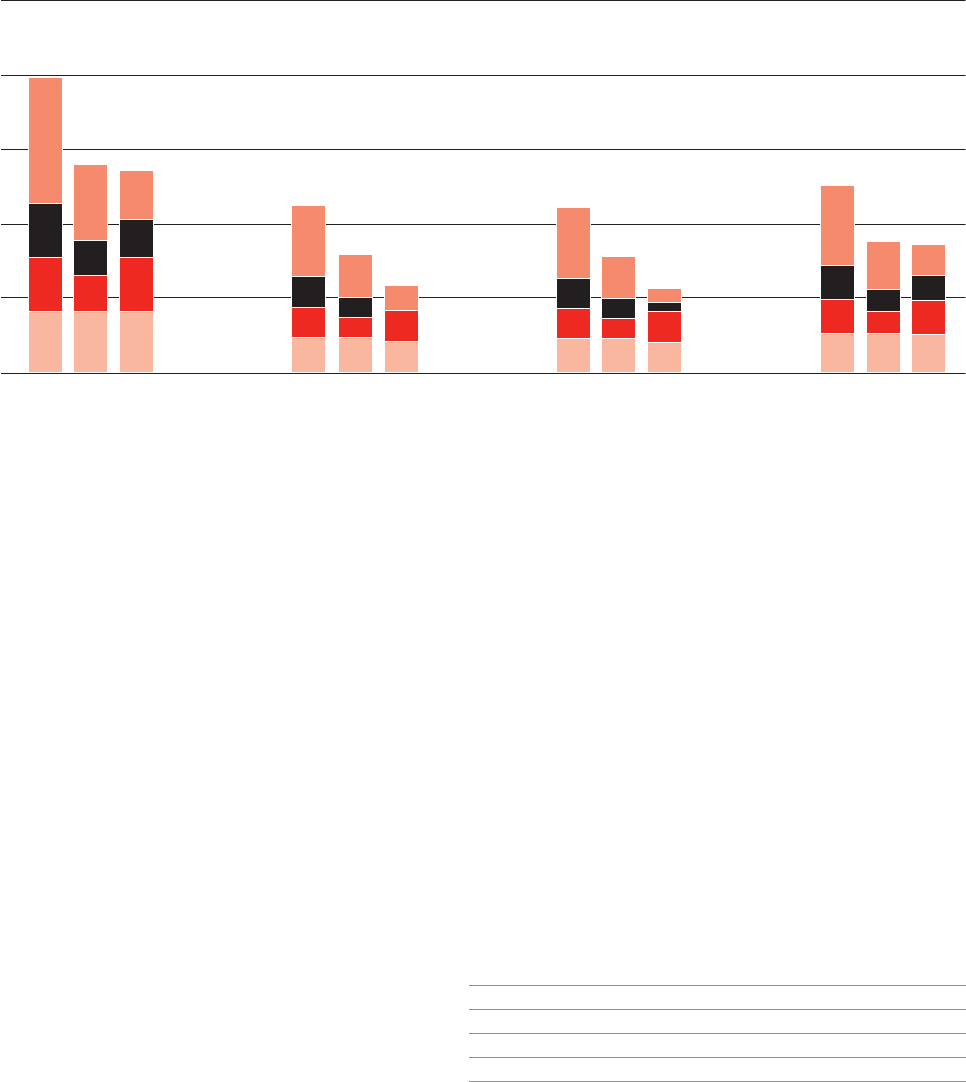
7. Total compensation
The charts below show the total value of Executive Director remuneration at maximum and target performance levels and show the actual
2010 outcome:
Notes:
• Actual base salary represents actual salary paid during the financial year. Maximum and Target base salary is annual.
• Actual annual bonus represents the cash amount payable in respect of financial year 2010.
• Actual deferred annual bonus shares represent the value at vesting for shares released in 2010 in respect of the 2006 financial year.
• Actual Long Term Incentive Plan represents the value at vesting for the 2007/2009 LTIP cycle.
• Target Long Term Incentive Plan is assumed to be halfway between threshold and maximum.
2010 2010
Andrew
Cosslett
2010
Maximum
Target
Actual
Maximum
Target
Actual
Maximum
Target
Actual
Maximum
Target
Actual
2010
Richard
Solomons
James
Abrahamson
Kirk
Kinsell
1,000
2,000
3,000
4,000
5,000
0
Value (£000)
� Base salary � Annual bonus � Deferred annual bonus shares � Long Term Incentive Plan
Share capital
No awards or grants over shares were made during 2010 that
would be dilutive of the Company’s ordinary share capital.
Current policy is to settle the majority of awards or grants under
the Company’s share plans with shares purchased in the market.
A number of options granted up to 2005 are yet to be exercised and
will be settled with the issue of new shares.
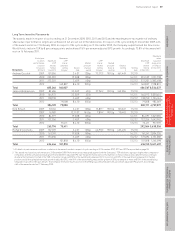
The following table shows the guideline and actual shareholdings
of the Executive Directors.
Actual
Guideline shareholding
shareholding at 31 Dec 2010
Director as % of salary as % of salary1
Andrew Cosslett 300 747
James Abrahamson2 200 138
Kirk Kinsell2 200 170
Richard Solomons 200 408
1 Based on share price of 1243p per share as at 31 December 2010.
2 Shareholding requirement took effect upon appointment to the Board on
1 August 2010.
8. Shareholding policy
Share ownership
The Committee believes that share ownership by Executive
Directors and senior executives strengthens the link between the
individual’s personal interests and those of the shareholders.
Executive Directors are expected to hold twice their base salary in
shares, or three times in the case of the Chief Executive. Executives
are expected to hold all shares earned (net of any share sales
required to meet personal tax liabilities) until their shareholding
requirement is achieved.
Executive share options
From 2006, executive share options have not formed part of the
Company’s remuneration structure. Details of prior share option
grants are given on page 60.