Holiday Inn 2010 Annual Report Download - page 106
Download and view the complete annual report
Please find page 106 of the 2010 Holiday Inn annual report below. You can navigate through the pages in the report by either clicking on the pages listed below, or by using the keyword search tool below to find specific information within the annual report.-
 1
1 -
2
-
3
-
4
-
5
-
6
-
7
-
8
-
9
-
10
-
11
-
12
-
13
-
14
-
15
-
16
-
17
-
18
-
19
-
20
-
21
-
22
-
23
-
24
-
25
-
26
-
27
-
28
-
29
-
30
-
31
-
32
-
33
-
34
-
35
-
36
-
37
-
38
-
39
-
40
-
41
-
42
-
43
-
44
-
45
-
46
-
47
-
48
-
49
-
50
-
51
-
52
-
53
-
54
-
55
-
56
-
57
-
58
-
59
-
60
-
61
-
62
-
63
-
64
-
65
-
66
-
67
-
68
-
69
-
70
-
71
-
72
-
73
-
74
-
75
-
76
-
77
-
78
-
79
-
80
-
81
-
82
-
83
-
84
-
85
-
86
-
87
-
88
-
89
-
90
-
91
-
92
-
93
-
94
-
95
-
 96
96 -
 97
97 -
 98
98 -
 99
99 -
 100
100 -
 101
101 -
 102
102 -
 103
103 -
 104
104 -
 105
105 -
 106
106 -
 107
107 -
 108
108 -
 109
109 -
 110
110 -
 111
111 -
 112
112 -
 113
113 -
 114
114 -
 115
115 -
 116
116 -
117
-
118
-
119
-
120
-
121
-
122
-
123
-
124
 |
 |

104 IHG Annual Report and Financial Statements 2010
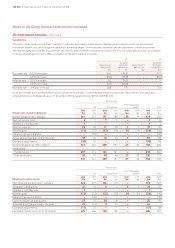
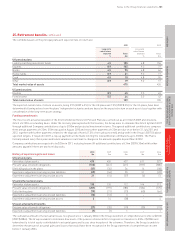
27. Share-based payments continued
The Group recognised a cost of $32m (2009 $22m) in operating profit and $1m (2009 $2m) within exceptional administrative expenses
related to equity-settled share-based payment transactions during the year.
The aggregate consideration in respect of ordinary shares issued under option schemes during the year was $19m (2009 $11m).
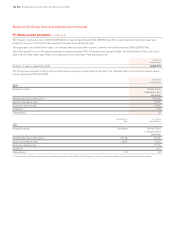
The following table sets forth awards and options granted during 2010. No awards were granted under the Annual Bonus Plan, Executive
Share Option Plan, Sharesave Plan or US Employee Stock Purchase Plan during the year.
Long Term
Incentive Plan
Number of shares awarded in 2010 2,602,773
The Group uses separate option pricing models and assumptions depending on the plan. The following tables set forth information about
options granted in 2010 and 2009:
Long Term
Incentive Plan
2010
Valuation model Monte Carlo
Simulation and
Binomial
Weighted average share price 1,033.0p
Expected dividend yield 3.10%
Risk-free interest rate 1.83%
Volatility* 41%
Term (years) 3.0
Annual Bonus Long Term
Plan Incentive Plan
2009
Valuation model Binomial Monte Carlo
Simulation and
Binomial
Weighted average share price 454.0p 612.0p
Expected dividend yield 4.89% 5.26%
Risk-free interest rate 2.11%
Volatility* 43%
Term (years) 3.0 3.0
* The expected volatility was determined by calculating the historical volatility of the Company’s share price corresponding to the expected life of the share award.
Notes to the Group financial statements continued