Holiday Inn 2010 Annual Report Download - page 18
Download and view the complete annual report
Please find page 18 of the 2010 Holiday Inn annual report below. You can navigate through the pages in the report by either clicking on the pages listed below, or by using the keyword search tool below to find specific information within the annual report.-
 1
1 -
2
-
3
-
4
-
5
-
6
-
7
-
 8
8 -
 9
9 -
 10
10 -
 11
11 -
 12
12 -
 13
13 -
 14
14 -
 15
15 -
 16
16 -
 17
17 -
 18
18 -
 19
19 -
 20
20 -
 21
21 -
 22
22 -
 23
23 -
 24
24 -
 25
25 -
 26
26 -
 27
27 -
 28
28 -
29
-
30
-
31
-
32
-
33
-
34
-
35
-
36
-
37
-
38
-
39
-
40
-
41
-
42
-
43
-
44
-
45
-
46
-
47
-
48
-
49
-
50
-
51
-
52
-
53
-
54
-
55
-
56
-
57
-
58
-
59
-
60
-
61
-
62
-
63
-
64
-
65
-
66
-
67
-
68
-
69
-
70
-
71
-
72
-
73
-
74
-
75
-
76
-
77
-
78
-
79
-
80
-
81
-
82
-
83
-
84
-
85
-
86
-
87
-
88
-
89
-
90
-
91
-
92
-
93
-
94
-
95
-
96
-
97
-
98
-
99
-
100
-
101
-
102
-
103
-
104
-
105
-
106
-
107
-
108
-
109
-
110
-
111
-
112
-
113
-
114
-
115
-
116
-
117
-
118
-
119
-
120
-
121
-
122
-
123
-
124
 |
 |

Business review continued
16 IHG Annual Report and Financial Statements 2010
The Americas
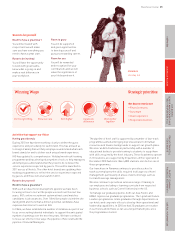
Americas strategic role 2011 priorities
To leverage our outstanding brand portfolio, focusing on our
substantial midscale franchise sector.
• Execute our strategic plans of becoming a brand-led business
by delivering Great Hotels Guests Love and increasing revenue
share;
• build upon the success of the Holiday Inn relaunch to continue
to grow the Holiday Inn brand family;
• optimise Crowne Plaza’s position within its segment; and
• deliver our People Tools to include the franchised estate.
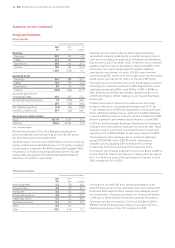
Americas results
12 months ended 31 December
2010 2009 %
$m $m change
Revenue
Franchised 465 437 6.4
Managed 119 110 8.2
Owned and leased 223 225 (0.9)
Total 807 772 4.5
Operating profit before exceptional items
Franchised 392 364 7.7
Managed 21 (40) 152.5
Owned and leased 13 11 18.2
426 335 27.2
Regional overheads (57) (47) (21.3)
Total 369 288 28.1
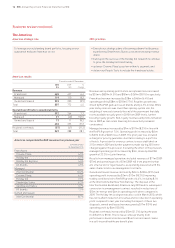
Americas comparable RevPAR movement on previous year
12 months ended
31 December 2010
Franchised
Crowne Plaza 4.5%
Holiday Inn 4.1%
Holiday Inn Express 4.4%
All brands 4.5%
Managed
InterContinental 10.2%
Crowne Plaza 6.2%
Holiday Inn 7.1%
Staybridge Suites 6.3%
Candlewood Suites 3.7%
All brands 7.5%
Owned and leased
InterContinental 8.7%
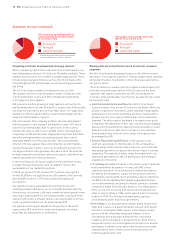
Revenue and operating profit before exceptional items increased
by $35m to $807m (4.5%) and $81m to $369m (28.1%) respectively.
Franchised revenue increased by $28m to $465m (6.4%) and
operating profit by $28m to $392m (7.7%). Royalties growth was
driven by RevPAR gains across all brands and by 4.5% in total. While
year end system size was lower than opening system size, the
weighting of removals towards the end of the year meant that daily
rooms available actually grew in 2010 from 2009 levels, further
boosting royalty growth. Non-royalty revenues and profits remained
flat on 2009, as real estate financing for new activity remained
constrained.
Managed revenue increased by $9m to $119m (8.2%) in line with
the RevPAR growth of 7.5%. Operating profit increased by $61m
to $21m from a $40m loss in 2009. The prior year loss included
a charge for priority guarantee shortfalls relating to a portfolio
of hotels. A provision for onerous contracts was established on
31 December 2009 and further payments made during 2010 were
charged against this provision. Excluding the effect of the provision,
managed operating profit increased by $3m, driven by RevPAR
growth of 23.3% in Latin America.
Results from managed operations included revenues of $71m (2009
$71m) and operating profit of $1m (2009 nil) from properties that
are structured, for legal reasons, as operating leases but with the
same characteristics as management contracts.
Owned and leased revenue declined by $2m to $223m (0.9%) and
operating profit increased by $2m to $13m (18.2%). Improving
trading conditions led to RevPAR growth of 6.4%, including 8.1%
at the InterContinental New York Barclay. The disposal of the
InterContinental Buckhead, Atlanta in July 2010 and its subsequent
conversion to a management contract resulted in reductions of
$15m in revenue and $4m in operating profit when compared to
2009. The Holiday Inn Lexington was also sold in March 2010, which
has led to a $4m reduction in revenue and no reduction in operating
profit compared to last year. Excluding the impact of these two
disposals, owned and leased revenue grew by $17m (9.0%) and
operating profit by $6m (150.0%).
Regional overheads increased by $10m (21.3%) during the year,
from $47m to $57m. The increase comes primarily from
performance-based incentives and $4m from increased claims
in a self-insured healthcare benefit plan.