Holiday Inn 2010 Annual Report Download - page 61
Download and view the complete annual report
Please find page 61 of the 2010 Holiday Inn annual report below. You can navigate through the pages in the report by either clicking on the pages listed below, or by using the keyword search tool below to find specific information within the annual report.-
 1
1 -
2
-
3
-
4
-
5
-
6
-
7
-
8
-
9
-
10
-
11
-
12
-
13
-
14
-
15
-
16
-
17
-
18
-
19
-
20
-
21
-
22
-
23
-
24
-
25
-
26
-
27
-
28
-
29
-
30
-
31
-
32
-
33
-
34
-
35
-
36
-
37
-
38
-
39
-
40
-
41
-
42
-
43
-
44
-
45
-
46
-
47
-
48
-
49
-
50
-
 51
51 -
 52
52 -
 53
53 -
 54
54 -
 55
55 -
 56
56 -
 57
57 -
 58
58 -
 59
59 -
 60
60 -
 61
61 -
 62
62 -
 63
63 -
 64
64 -
 65
65 -
 66
66 -
 67
67 -
 68
68 -
 69
69 -
 70
70 -
 71
71 -
72
-
73
-
74
-
75
-
76
-
77
-
78
-
79
-
80
-
81
-
82
-
83
-
84
-
85
-
86
-
87
-
88
-
89
-
90
-
91
-
92
-
93
-
94
-
95
-
96
-
97
-
98
-
99
-
100
-
101
-
102
-
103
-
104
-
105
-
106
-
107
-
108
-
109
-
110
-
111
-
112
-
113
-
114
-
115
-
116
-
117
-
118
-
119
-
120
-
121
-
122
-
123
-
124
 |
 |

OVERVIEW BUSINESS REVIEW
THE BOARD,
SENIOR MANAGEMENT AND
THEIR RESPONSIBILITIES
GROUP FINANCIAL
STATEMENTS
PARENT COMPANY
FINANCIAL STATEMENTS USEFUL INFORMATION
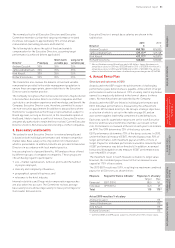
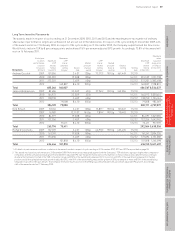
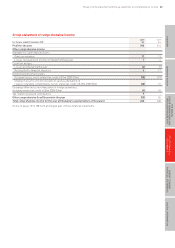
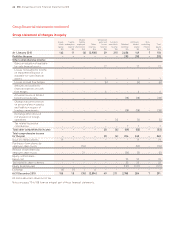
Long Term Incentive Plan awards
The awards made in respect of cycles ending on 31 December 2009, 2010, 2011 and 2012 and the maximum pre-tax number of ordinary
shares due if performance targets are achieved in full are set out in the table below. In respect of the cycle ending 31 December 2009, 46%
of the award vested on 17 February 2010. In respect of the cycle ending on 31 December 2010, the Company outperformed the Dow Jones
World Hotels index in TSR by 8 percentage points and achieved 9.6% per annum adjusted EPS growth. Accordingly, 73.8% of the award will
vest on 16 February 2011.
Maximum
End of year Maximum value
to which Maximum LTIP LTIP Maximum based on
performance LTIP shares Market shares Market LTIP share price
is based awards awarded price per vested price per Value at awards of 1243p at
for award held at during Award share at during share at vesting Vesting held at 31 Dec 2010
Directors (31 Dec)
1 1 Jan 2010 the year date award the year vesting £ date 31 Dec 2010 £
Andrew Cosslett 2009 159,506 2.4.07 1256p 73,372
2 901.5p 661,449 17.2.10
2010 253,559 19.5.08 854p 16.2.11 253,559 3,151,738
2011 272,201 3.4.09 604p 15.2.12 272,201 3,383,458
2012 160,807 8.4.10 1053p 13.2.13 160,807 1,998,831
Total 685,266 160,807 686,567 8,534,027
James Abrahamson 2009 82,486 23.2.09 457p 37,943
2 901.5p 342,056 17.2.10
2010 164,973 23.2.09 457p 16.2.11 164,973 2,050,614
2011 138,730 3.4.09 604p 15.2.12 138,730 1,724,414
2012 79,008 8.4.10 1053p 13.2.13 79,008 982,069
Total 386,189 79,008 382,711 4,757,097
Kirk Kinsell 2009 30,156 2.4.07 1256p 13,871 2 901.5p 125,047 17.2.10
2009 16,987 12.11.07 961.5p 7,814 2 901.5p 70,443 17.2.10
2010 84,397 19.5.08 854p 16.2.11 84,397 1,049,055
2011 132,256 3.4.09 604p 15.2.12 132,256 1,643,942
2012 75,411 8.4.10 1053p 13.2.13 75,411 937,359
Total 263,796 75,411 292,064 3,630,356
Richard Solomons 2009 102,109 2.4.07 1256p 46,970 2 901.5p 423,435 17.2.10
2010 161,241 19.5.08 854p 16.2.11 161,241 2,004,226
2011 173,096 3.4.09 604p 15.2.12 173,096 2,151,583
2012 101,818 8.4.10 1053p 13.2.13 101,818 1,265,598
Total 436,446 101,818 436,155 5,421,407
1 All details of performance conditions in relation to the awards made in respect of cycles ending on 31 December 2010, 2011 and 2012 are provided on page 53.
2 This award was based on performance to 31 December 2009. Performance was measured against both the Company’s TSR relative to a group of eight other comparator
companies and the cumulative annual growth rate (CAGR) in adjusted EPS over the performance period. The number of shares released was determined according to
a) where the Company finished in the TSR comparator group, with 50% of the award being released for first position and 10% of the award being released for median
position; and b) the cumulative annual growth in adjusted EPS, with 50% of the award being released for growth of 20% per annum or more and 10% of the award being
released for growth of 10% per annum. The Company finished in fourth position in the TSR group and achieved 15.2% per annum adjusted EPS growth. Accordingly,
46% of the award vested on 17 February 2010.
Remuneration report 59