Holiday Inn 2010 Annual Report Download - page 81
Download and view the complete annual report
Please find page 81 of the 2010 Holiday Inn annual report below. You can navigate through the pages in the report by either clicking on the pages listed below, or by using the keyword search tool below to find specific information within the annual report.-
 1
1 -
2
-
3
-
4
-
5
-
6
-
7
-
8
-
9
-
10
-
11
-
12
-
13
-
14
-
15
-
16
-
17
-
18
-
19
-
20
-
21
-
22
-
23
-
24
-
25
-
26
-
27
-
28
-
29
-
30
-
31
-
32
-
33
-
34
-
35
-
36
-
37
-
38
-
39
-
40
-
41
-
42
-
43
-
44
-
45
-
46
-
47
-
48
-
49
-
50
-
51
-
52
-
53
-
54
-
55
-
56
-
57
-
58
-
59
-
60
-
61
-
62
-
63
-
64
-
65
-
66
-
67
-
68
-
69
-
70
-
 71
71 -
 72
72 -
 73
73 -
 74
74 -
 75
75 -
 76
76 -
 77
77 -
 78
78 -
 79
79 -
 80
80 -
 81
81 -
 82
82 -
 83
83 -
 84
84 -
 85
85 -
 86
86 -
 87
87 -
 88
88 -
 89
89 -
 90
90 -
 91
91 -
92
-
93
-
94
-
95
-
96
-
97
-
98
-
99
-
100
-
101
-
102
-
103
-
104
-
105
-
106
-
107
-
108
-
109
-
110
-
111
-
112
-
113
-
114
-
115
-
116
-
117
-
118
-
119
-
120
-
121
-
122
-
123
-
124
 |
 |

OVERVIEW BUSINESS REVIEW
THE BOARD,
SENIOR MANAGEMENT AND
THEIR RESPONSIBILITIES
GROUP FINANCIAL
STATEMENTS
PARENT COMPANY
FINANCIAL STATEMENTS USEFUL INFORMATION
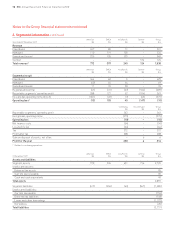
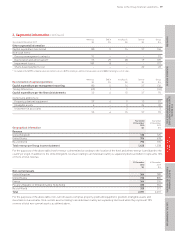
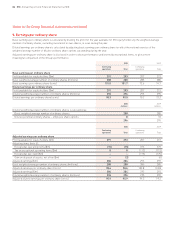
2. Segmental information continued
Americas EMEA Asia Pacific Central Group
Year ended 31 December 2009 $m $m $m $m $m
Other segmental information
Capital expenditure (see below) 80 5 14 37 136
Non-cash items:
Onerous management contracts 91 – – – 91
Depreciation and amortisation* 33 29 28 19 109
Impairment losses 189 8 – – 197
Share-based payments cost – – – 22 22
* Included in the $109m of depreciation and amortisation is $29m relating to administrative expenses and $80m relating to cost of sales.
Americas EMEA Asia Pacific Central Group
Reconciliation of capital expenditure $m $m $m $m $m
Capital expenditure per management reporting 80 5 14 37 136
Timing differences (45) 1 1 – (43)
Capital expenditure per the financial statements 35 6 15 37 93
Comprising additions to:
Property, plant and equipment 29 6 9 13 57
Intangible assets 6 – 3 24 33
Investment in associates – – 3 – 3
35 6 15 37 93
Year ended Year ended
31 December 31 December
2010 2009
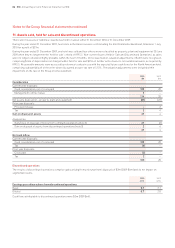
Geographical information $m $m
Revenue
United Kingdom 130 125
United States 706 678
Rest of World 792 735
Total revenue per Group income statement 1,628 1,538
For the purposes of the above table, hotel revenue is determined according to the location of the hotel and other revenue is attributed to the
country of origin. In addition to the United Kingdom, revenue relating to an individual country is separately disclosed when it represents 10%
or more of total revenue.
31 December 31 December
2010 2009
$m $m
Non-current assets
United Kingdom 366 389
United States 726 805
France 344 376
People’s Republic of China (including Hong Kong) 335 354
Rest of World 320 313
Total 2,091 2,237
For the purposes of the above table, non-current assets comprise property, plant and equipment, goodwill, intangible assets and
investments in associates. Non-current assets relating to an individual country are separately disclosed when they represent 10%
or more of total non-current assets, as defined above.
Notes to the Group financial statements 79