Holiday Inn 2010 Annual Report Download - page 23
Download and view the complete annual report
Please find page 23 of the 2010 Holiday Inn annual report below. You can navigate through the pages in the report by either clicking on the pages listed below, or by using the keyword search tool below to find specific information within the annual report.-
 1
1 -
2
-
3
-
4
-
5
-
6
-
7
-
8
-
9
-
10
-
11
-
12
-
 13
13 -
 14
14 -
 15
15 -
 16
16 -
 17
17 -
 18
18 -
 19
19 -
 20
20 -
 21
21 -
 22
22 -
 23
23 -
 24
24 -
 25
25 -
 26
26 -
 27
27 -
 28
28 -
 29
29 -
 30
30 -
 31
31 -
 32
32 -
 33
33 -
34
-
35
-
36
-
37
-
38
-
39
-
40
-
41
-
42
-
43
-
44
-
45
-
46
-
47
-
48
-
49
-
50
-
51
-
52
-
53
-
54
-
55
-
56
-
57
-
58
-
59
-
60
-
61
-
62
-
63
-
64
-
65
-
66
-
67
-
68
-
69
-
70
-
71
-
72
-
73
-
74
-
75
-
76
-
77
-
78
-
79
-
80
-
81
-
82
-
83
-
84
-
85
-
86
-
87
-
88
-
89
-
90
-
91
-
92
-
93
-
94
-
95
-
96
-
97
-
98
-
99
-
100
-
101
-
102
-
103
-
104
-
105
-
106
-
107
-
108
-
109
-
110
-
111
-
112
-
113
-
114
-
115
-
116
-
117
-
118
-
119
-
120
-
121
-
122
-
123
-
124
 |
 |

Business review 21
OVERVIEW BUSINESS REVIEW
THE BOARD,
SENIOR MANAGEMENT AND
THEIR RESPONSIBILITIES
GROUP FINANCIAL
STATEMENTS
PARENT COMPANY
FINANCIAL STATEMENTS USEFUL INFORMATION
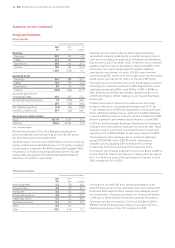
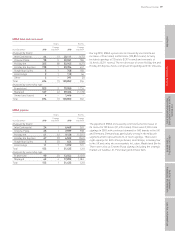
Hotels Rooms
Change Change
At 31 December 2010 over 2009 2010 over 2009
Analysed by brand
InterContinental 51 5 19,198 2,162
Crowne Plaza 81 10 26,141 2,994
Holiday Inn 104 2 29,597 602
Holiday Inn Express 30 4 7,655 1,191
Hotel Indigo 1 1 184 184
Other 18 (1) 4,159 (1,228)
Total 285 21 86,934 5,905
Analysed by ownership type
Franchised 30 (4) 6,834 (487)
Managed 253 25 79,407 6,392
Owned and leased 2 – 693 –
Total 285 21 86,934 5,905
Asia Pacific hotel and room count increased by 21 hotels (5,905
rooms) to 285 hotels (86,934 rooms). Openings of 32 hotels (8,997
rooms) were partially offset by the removal of 11 hotels (3,092
rooms). The growth was driven by 24 hotel openings in 17 cities
across Greater China (7,253 rooms), seven hotels (1,477 rooms)
more than in 2009. This included key hotel openings in Shanghai
of the InterContinental at the Expo site and the Hotel Indigo on the
Bund, the first opening for this brand in Asia Pacific. Across the
region 65% of rooms opened were in upscale brands
(InterContinental, Crowne Plaza and Hotel Indigo).
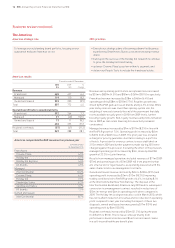
Asia Pacific hotel and room count
Hotels Rooms
Change Change
At 31 December 2010 over 2009 2010 over 2009
Analysed by brand
InterContinental 31 (3) 11,565 (468)
Crowne Plaza 71 (1) 25,726 774
Holiday Inn 85 8 23,117 2,480
Holiday Inn Express 40 12 9,685 2,455
Hotel Indigo 5 3 822 500
Total 232 19 70,915 5,741
Analysed by ownership type
Franchised 2 – 326 –
Managed 230 19 70,589 5,741
Total 232 19 70,915 5,741
The pipeline in Asia Pacific increased by 19 hotels (5,741 rooms)
to 232 hotels (70,915 rooms). Pipeline growth was evenly balanced
between the Greater China market (nine hotels, 3,128 rooms) and
Asia Australasia (10 hotels, 2,613 rooms) including six hotel signings
in India taking its total pipeline to 10,073 rooms.
Across the region there were 18 Holiday Inn Express signings,
more than double the number for this brand in 2009 indicating the
potential for midscale growth in the region. In Vietnam two new
Holiday Inn resorts were signed in prime beach-front locations of
Cam Ranh Bay and Phu Quoc. There were also 12 Crowne Plaza
signings, including the Crowne Plaza Lumpini Park in Bangkok.
Asia Pacific pipeline